Immigrants from Zaire vs Iraqi College, 1 year or more
COMPARE
Immigrants from Zaire
Iraqi
College, 1 year or more
College, 1 year or more Comparison
Immigrants from Zaire
Iraqis
58.3%
COLLEGE, 1 YEAR OR MORE
18.7/ 100
METRIC RATING
205th/ 347
METRIC RANK
60.7%
COLLEGE, 1 YEAR OR MORE
83.3/ 100
METRIC RATING
140th/ 347
METRIC RANK
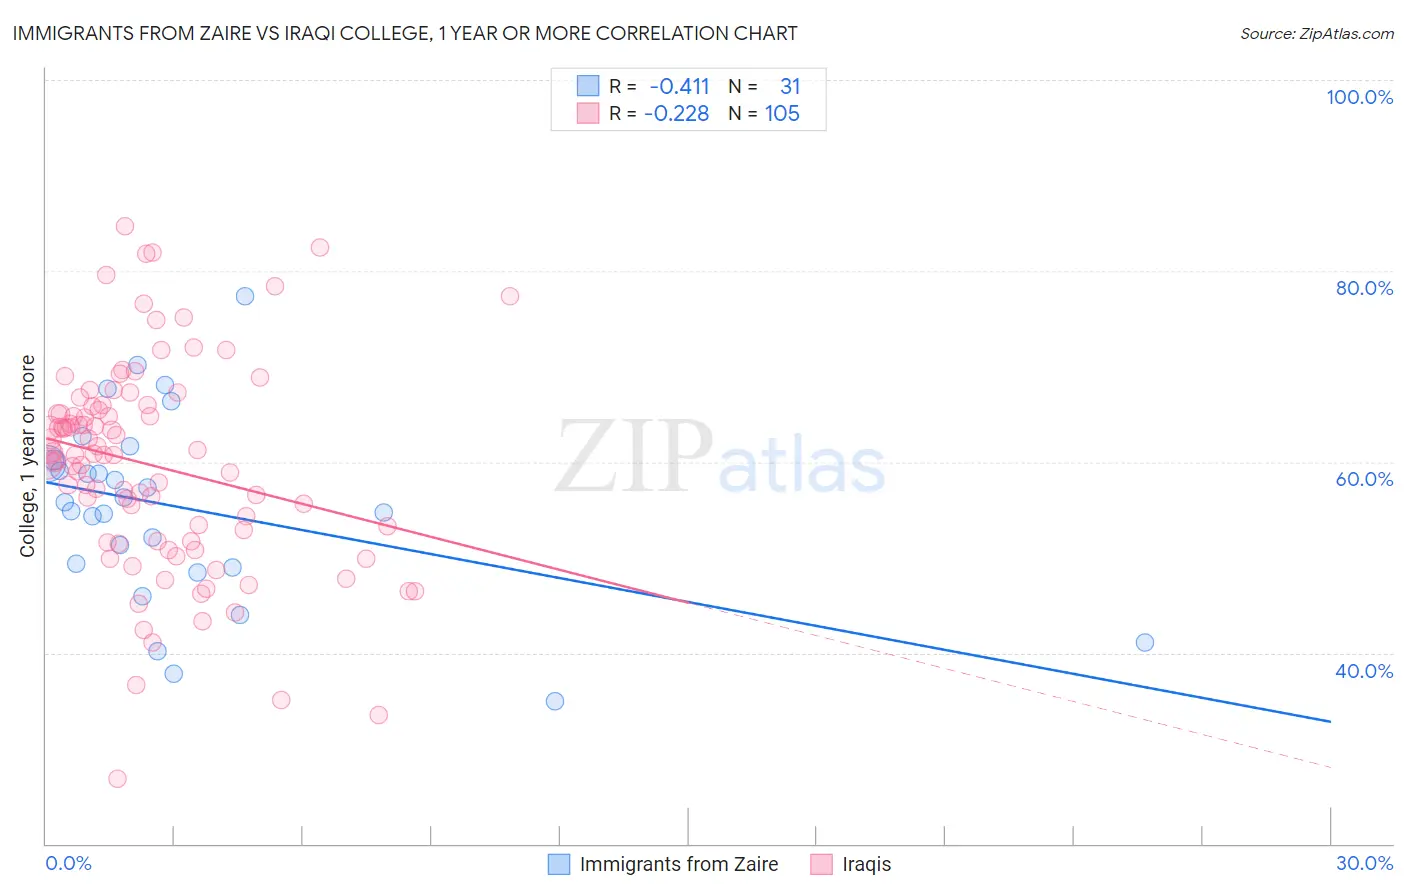
Immigrants from Zaire vs Iraqi College, 1 year or more Correlation Chart
The statistical analysis conducted on geographies consisting of 107,255,700 people shows a moderate negative correlation between the proportion of Immigrants from Zaire and percentage of population with at least college, 1 year or more education in the United States with a correlation coefficient (R) of -0.411 and weighted average of 58.3%. Similarly, the statistical analysis conducted on geographies consisting of 170,654,197 people shows a weak negative correlation between the proportion of Iraqis and percentage of population with at least college, 1 year or more education in the United States with a correlation coefficient (R) of -0.228 and weighted average of 60.7%, a difference of 4.2%.
College, 1 year or more Correlation Summary
| Measurement | Immigrants from Zaire | Iraqi |
| Minimum | 35.0% | 26.8% |
| Maximum | 77.4% | 84.7% |
| Range | 42.4% | 57.8% |
| Mean | 55.2% | 59.6% |
| Median | 55.8% | 60.8% |
| Interquartile 25% (IQ1) | 48.9% | 51.7% |
| Interquartile 75% (IQ3) | 60.2% | 65.6% |
| Interquartile Range (IQR) | 11.3% | 13.9% |
| Standard Deviation (Sample) | 9.8% | 10.9% |
| Standard Deviation (Population) | 9.6% | 10.8% |
Similar Demographics by College, 1 year or more
Demographics Similar to Immigrants from Zaire by College, 1 year or more
In terms of college, 1 year or more, the demographic groups most similar to Immigrants from Zaire are Immigrants from Vietnam (58.2%, a difference of 0.040%), Panamanian (58.3%, a difference of 0.050%), Senegalese (58.2%, a difference of 0.16%), Ghanaian (58.4%, a difference of 0.19%), and Immigrants from South America (58.4%, a difference of 0.27%).
| Demographics | Rating | Rank | College, 1 year or more |
| Immigrants | South Eastern Asia | 25.1 /100 | #198 | Fair 58.5% |
| Slovaks | 24.6 /100 | #199 | Fair 58.5% |
| Spanish | 24.2 /100 | #200 | Fair 58.5% |
| Nigerians | 23.0 /100 | #201 | Fair 58.5% |
| Immigrants | South America | 21.9 /100 | #202 | Fair 58.4% |
| Ghanaians | 20.9 /100 | #203 | Fair 58.4% |
| Panamanians | 19.2 /100 | #204 | Poor 58.3% |
| Immigrants | Zaire | 18.7 /100 | #205 | Poor 58.3% |
| Immigrants | Vietnam | 18.2 /100 | #206 | Poor 58.2% |
| Senegalese | 16.9 /100 | #207 | Poor 58.2% |
| Immigrants | Uruguay | 15.2 /100 | #208 | Poor 58.1% |
| Immigrants | Middle Africa | 14.0 /100 | #209 | Poor 58.0% |
| Tsimshian | 13.5 /100 | #210 | Poor 57.9% |
| Immigrants | Nigeria | 13.3 /100 | #211 | Poor 57.9% |
| Immigrants | Senegal | 11.8 /100 | #212 | Poor 57.8% |
Demographics Similar to Iraqis by College, 1 year or more
In terms of college, 1 year or more, the demographic groups most similar to Iraqis are Immigrants from Afghanistan (60.7%, a difference of 0.020%), Polish (60.7%, a difference of 0.050%), Canadian (60.6%, a difference of 0.050%), Immigrants from Eritrea (60.7%, a difference of 0.090%), and Taiwanese (60.7%, a difference of 0.10%).
| Demographics | Rating | Rank | College, 1 year or more |
| Immigrants | Uzbekistan | 88.0 /100 | #133 | Excellent 61.0% |
| Immigrants | Venezuela | 87.9 /100 | #134 | Excellent 61.0% |
| Immigrants | Uganda | 87.4 /100 | #135 | Excellent 60.9% |
| Basques | 87.2 /100 | #136 | Excellent 60.9% |
| Slovenes | 86.5 /100 | #137 | Excellent 60.9% |
| Taiwanese | 84.3 /100 | #138 | Excellent 60.7% |
| Immigrants | Eritrea | 84.3 /100 | #139 | Excellent 60.7% |
| Iraqis | 83.3 /100 | #140 | Excellent 60.7% |
| Immigrants | Afghanistan | 83.1 /100 | #141 | Excellent 60.7% |
| Poles | 82.8 /100 | #142 | Excellent 60.7% |
| Canadians | 82.7 /100 | #143 | Excellent 60.6% |
| Czechs | 81.9 /100 | #144 | Excellent 60.6% |
| Slavs | 81.1 /100 | #145 | Excellent 60.6% |
| Scottish | 80.2 /100 | #146 | Excellent 60.5% |
| Immigrants | Kenya | 79.1 /100 | #147 | Good 60.5% |