Immigrants from Zaire vs Sioux College, 1 year or more
COMPARE
Immigrants from Zaire
Sioux
College, 1 year or more
College, 1 year or more Comparison
Immigrants from Zaire
Sioux
58.3%
COLLEGE, 1 YEAR OR MORE
18.7/ 100
METRIC RATING
205th/ 347
METRIC RANK
53.0%
COLLEGE, 1 YEAR OR MORE
0.0/ 100
METRIC RATING
296th/ 347
METRIC RANK
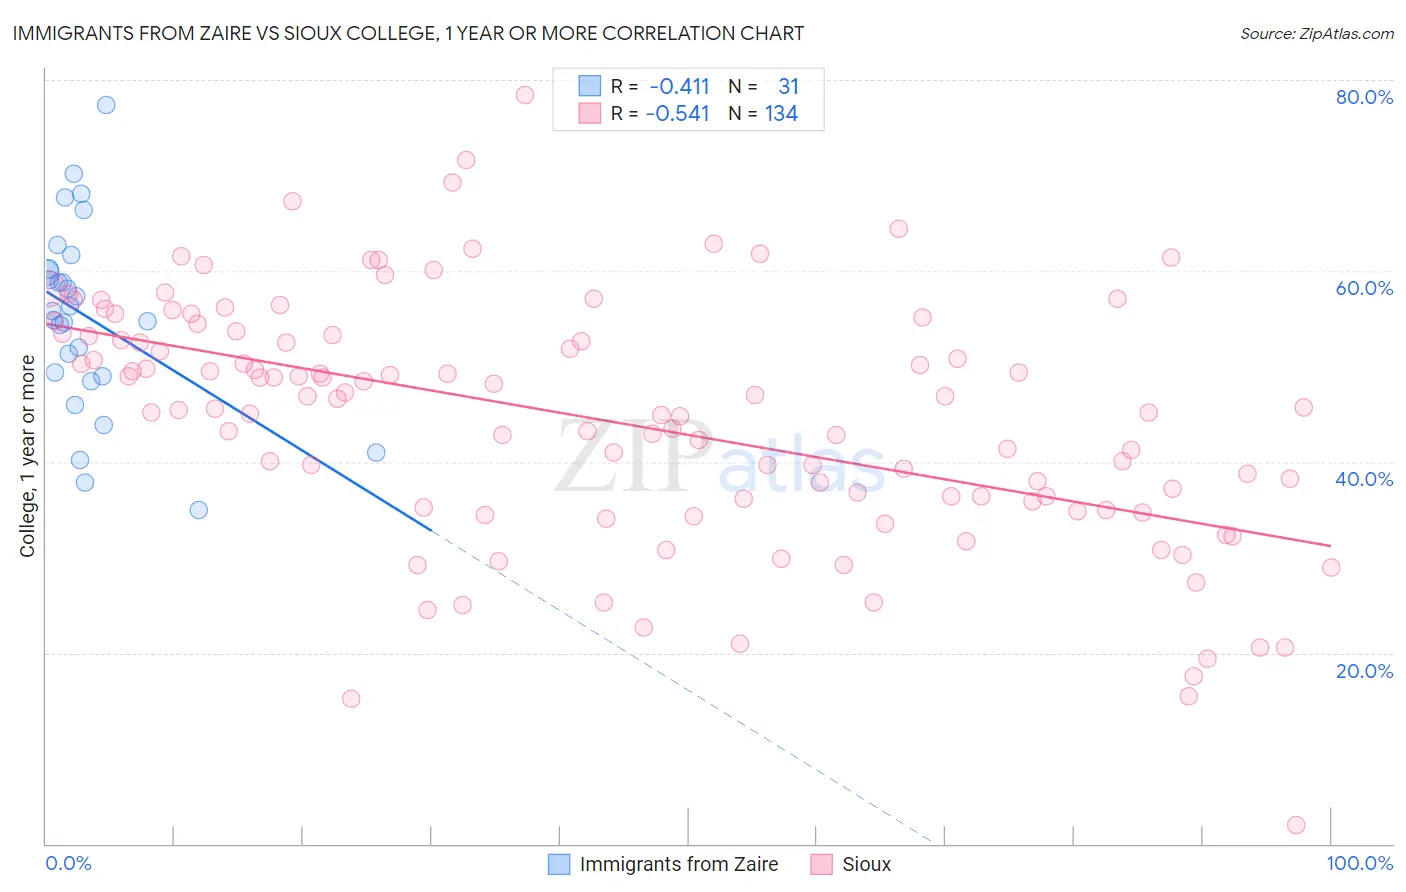
Immigrants from Zaire vs Sioux College, 1 year or more Correlation Chart
The statistical analysis conducted on geographies consisting of 107,255,700 people shows a moderate negative correlation between the proportion of Immigrants from Zaire and percentage of population with at least college, 1 year or more education in the United States with a correlation coefficient (R) of -0.411 and weighted average of 58.3%. Similarly, the statistical analysis conducted on geographies consisting of 234,199,467 people shows a substantial negative correlation between the proportion of Sioux and percentage of population with at least college, 1 year or more education in the United States with a correlation coefficient (R) of -0.541 and weighted average of 53.0%, a difference of 9.9%.
College, 1 year or more Correlation Summary
| Measurement | Immigrants from Zaire | Sioux |
| Minimum | 35.0% | 2.0% |
| Maximum | 77.4% | 78.4% |
| Range | 42.4% | 76.4% |
| Mean | 55.2% | 44.3% |
| Median | 55.8% | 45.6% |
| Interquartile 25% (IQ1) | 48.9% | 35.8% |
| Interquartile 75% (IQ3) | 60.2% | 53.3% |
| Interquartile Range (IQR) | 11.3% | 17.5% |
| Standard Deviation (Sample) | 9.8% | 13.0% |
| Standard Deviation (Population) | 9.6% | 12.9% |
Similar Demographics by College, 1 year or more
Demographics Similar to Immigrants from Zaire by College, 1 year or more
In terms of college, 1 year or more, the demographic groups most similar to Immigrants from Zaire are Immigrants from Vietnam (58.2%, a difference of 0.040%), Panamanian (58.3%, a difference of 0.050%), Senegalese (58.2%, a difference of 0.16%), Ghanaian (58.4%, a difference of 0.19%), and Immigrants from South America (58.4%, a difference of 0.27%).
| Demographics | Rating | Rank | College, 1 year or more |
| Immigrants | South Eastern Asia | 25.1 /100 | #198 | Fair 58.5% |
| Slovaks | 24.6 /100 | #199 | Fair 58.5% |
| Spanish | 24.2 /100 | #200 | Fair 58.5% |
| Nigerians | 23.0 /100 | #201 | Fair 58.5% |
| Immigrants | South America | 21.9 /100 | #202 | Fair 58.4% |
| Ghanaians | 20.9 /100 | #203 | Fair 58.4% |
| Panamanians | 19.2 /100 | #204 | Poor 58.3% |
| Immigrants | Zaire | 18.7 /100 | #205 | Poor 58.3% |
| Immigrants | Vietnam | 18.2 /100 | #206 | Poor 58.2% |
| Senegalese | 16.9 /100 | #207 | Poor 58.2% |
| Immigrants | Uruguay | 15.2 /100 | #208 | Poor 58.1% |
| Immigrants | Middle Africa | 14.0 /100 | #209 | Poor 58.0% |
| Tsimshian | 13.5 /100 | #210 | Poor 57.9% |
| Immigrants | Nigeria | 13.3 /100 | #211 | Poor 57.9% |
| Immigrants | Senegal | 11.8 /100 | #212 | Poor 57.8% |
Demographics Similar to Sioux by College, 1 year or more
In terms of college, 1 year or more, the demographic groups most similar to Sioux are Paiute (52.9%, a difference of 0.28%), Yaqui (53.2%, a difference of 0.34%), Cherokee (53.2%, a difference of 0.35%), Black/African American (53.3%, a difference of 0.56%), and Chickasaw (53.3%, a difference of 0.58%).
| Demographics | Rating | Rank | College, 1 year or more |
| Immigrants | Ecuador | 0.0 /100 | #289 | Tragic 53.4% |
| Alaskan Athabascans | 0.0 /100 | #290 | Tragic 53.4% |
| Cubans | 0.0 /100 | #291 | Tragic 53.4% |
| Chickasaw | 0.0 /100 | #292 | Tragic 53.3% |
| Blacks/African Americans | 0.0 /100 | #293 | Tragic 53.3% |
| Cherokee | 0.0 /100 | #294 | Tragic 53.2% |
| Yaqui | 0.0 /100 | #295 | Tragic 53.2% |
| Sioux | 0.0 /100 | #296 | Tragic 53.0% |
| Paiute | 0.0 /100 | #297 | Tragic 52.9% |
| Immigrants | Dominica | 0.0 /100 | #298 | Tragic 52.5% |
| Immigrants | Nicaragua | 0.0 /100 | #299 | Tragic 52.4% |
| Choctaw | 0.0 /100 | #300 | Tragic 52.3% |
| Haitians | 0.0 /100 | #301 | Tragic 52.3% |
| Puerto Ricans | 0.0 /100 | #302 | Tragic 52.2% |
| Creek | 0.0 /100 | #303 | Tragic 52.2% |