Immigrants from Zaire vs Immigrants from Croatia College, 1 year or more
COMPARE
Immigrants from Zaire
Immigrants from Croatia
College, 1 year or more
College, 1 year or more Comparison
Immigrants from Zaire
Immigrants from Croatia
58.3%
COLLEGE, 1 YEAR OR MORE
18.7/ 100
METRIC RATING
205th/ 347
METRIC RANK
62.3%
COLLEGE, 1 YEAR OR MORE
97.6/ 100
METRIC RATING
94th/ 347
METRIC RANK
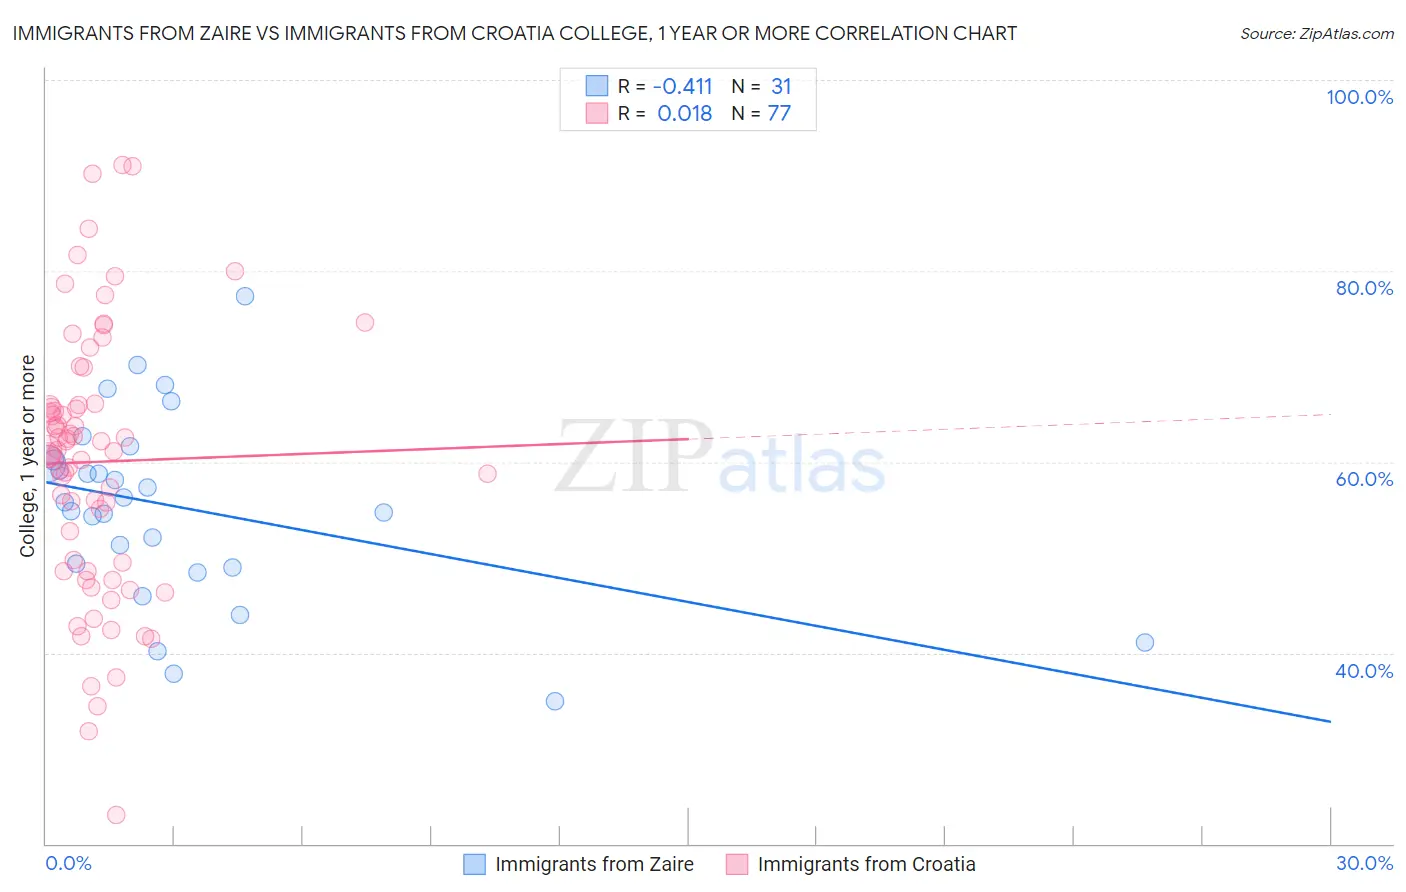
Immigrants from Zaire vs Immigrants from Croatia College, 1 year or more Correlation Chart
The statistical analysis conducted on geographies consisting of 107,255,700 people shows a moderate negative correlation between the proportion of Immigrants from Zaire and percentage of population with at least college, 1 year or more education in the United States with a correlation coefficient (R) of -0.411 and weighted average of 58.3%. Similarly, the statistical analysis conducted on geographies consisting of 132,577,989 people shows no correlation between the proportion of Immigrants from Croatia and percentage of population with at least college, 1 year or more education in the United States with a correlation coefficient (R) of 0.018 and weighted average of 62.3%, a difference of 7.0%.
College, 1 year or more Correlation Summary
| Measurement | Immigrants from Zaire | Immigrants from Croatia |
| Minimum | 35.0% | 23.1% |
| Maximum | 77.4% | 91.1% |
| Range | 42.4% | 68.0% |
| Mean | 55.2% | 60.0% |
| Median | 55.8% | 61.2% |
| Interquartile 25% (IQ1) | 48.9% | 49.0% |
| Interquartile 75% (IQ3) | 60.2% | 66.0% |
| Interquartile Range (IQR) | 11.3% | 17.0% |
| Standard Deviation (Sample) | 9.8% | 13.8% |
| Standard Deviation (Population) | 9.6% | 13.7% |
Similar Demographics by College, 1 year or more
Demographics Similar to Immigrants from Zaire by College, 1 year or more
In terms of college, 1 year or more, the demographic groups most similar to Immigrants from Zaire are Immigrants from Vietnam (58.2%, a difference of 0.040%), Panamanian (58.3%, a difference of 0.050%), Senegalese (58.2%, a difference of 0.16%), Ghanaian (58.4%, a difference of 0.19%), and Immigrants from South America (58.4%, a difference of 0.27%).
| Demographics | Rating | Rank | College, 1 year or more |
| Immigrants | South Eastern Asia | 25.1 /100 | #198 | Fair 58.5% |
| Slovaks | 24.6 /100 | #199 | Fair 58.5% |
| Spanish | 24.2 /100 | #200 | Fair 58.5% |
| Nigerians | 23.0 /100 | #201 | Fair 58.5% |
| Immigrants | South America | 21.9 /100 | #202 | Fair 58.4% |
| Ghanaians | 20.9 /100 | #203 | Fair 58.4% |
| Panamanians | 19.2 /100 | #204 | Poor 58.3% |
| Immigrants | Zaire | 18.7 /100 | #205 | Poor 58.3% |
| Immigrants | Vietnam | 18.2 /100 | #206 | Poor 58.2% |
| Senegalese | 16.9 /100 | #207 | Poor 58.2% |
| Immigrants | Uruguay | 15.2 /100 | #208 | Poor 58.1% |
| Immigrants | Middle Africa | 14.0 /100 | #209 | Poor 58.0% |
| Tsimshian | 13.5 /100 | #210 | Poor 57.9% |
| Immigrants | Nigeria | 13.3 /100 | #211 | Poor 57.9% |
| Immigrants | Senegal | 11.8 /100 | #212 | Poor 57.8% |
Demographics Similar to Immigrants from Croatia by College, 1 year or more
In terms of college, 1 year or more, the demographic groups most similar to Immigrants from Croatia are Romanian (62.4%, a difference of 0.060%), Immigrants from Eastern Europe (62.4%, a difference of 0.090%), Immigrants from Egypt (62.4%, a difference of 0.090%), British (62.3%, a difference of 0.10%), and Immigrants from Western Asia (62.5%, a difference of 0.20%).
| Demographics | Rating | Rank | College, 1 year or more |
| Immigrants | Hungary | 98.6 /100 | #87 | Exceptional 62.7% |
| Greeks | 98.3 /100 | #88 | Exceptional 62.6% |
| Immigrants | Ethiopia | 98.2 /100 | #89 | Exceptional 62.6% |
| Immigrants | Western Asia | 97.9 /100 | #90 | Exceptional 62.5% |
| Immigrants | Eastern Europe | 97.8 /100 | #91 | Exceptional 62.4% |
| Immigrants | Egypt | 97.8 /100 | #92 | Exceptional 62.4% |
| Romanians | 97.7 /100 | #93 | Exceptional 62.4% |
| Immigrants | Croatia | 97.6 /100 | #94 | Exceptional 62.3% |
| British | 97.4 /100 | #95 | Exceptional 62.3% |
| Chinese | 97.2 /100 | #96 | Exceptional 62.2% |
| Jordanians | 97.2 /100 | #97 | Exceptional 62.2% |
| Carpatho Rusyns | 97.2 /100 | #98 | Exceptional 62.2% |
| Croatians | 97.1 /100 | #99 | Exceptional 62.2% |
| Icelanders | 96.8 /100 | #100 | Exceptional 62.1% |
| Swedes | 96.8 /100 | #101 | Exceptional 62.1% |