Immigrants from Asia vs Immigrants from Croatia College, 1 year or more
COMPARE
Immigrants from Asia
Immigrants from Croatia
College, 1 year or more
College, 1 year or more Comparison
Immigrants from Asia
Immigrants from Croatia
64.0%
COLLEGE, 1 YEAR OR MORE
99.7/ 100
METRIC RATING
58th/ 347
METRIC RANK
62.3%
COLLEGE, 1 YEAR OR MORE
97.6/ 100
METRIC RATING
94th/ 347
METRIC RANK
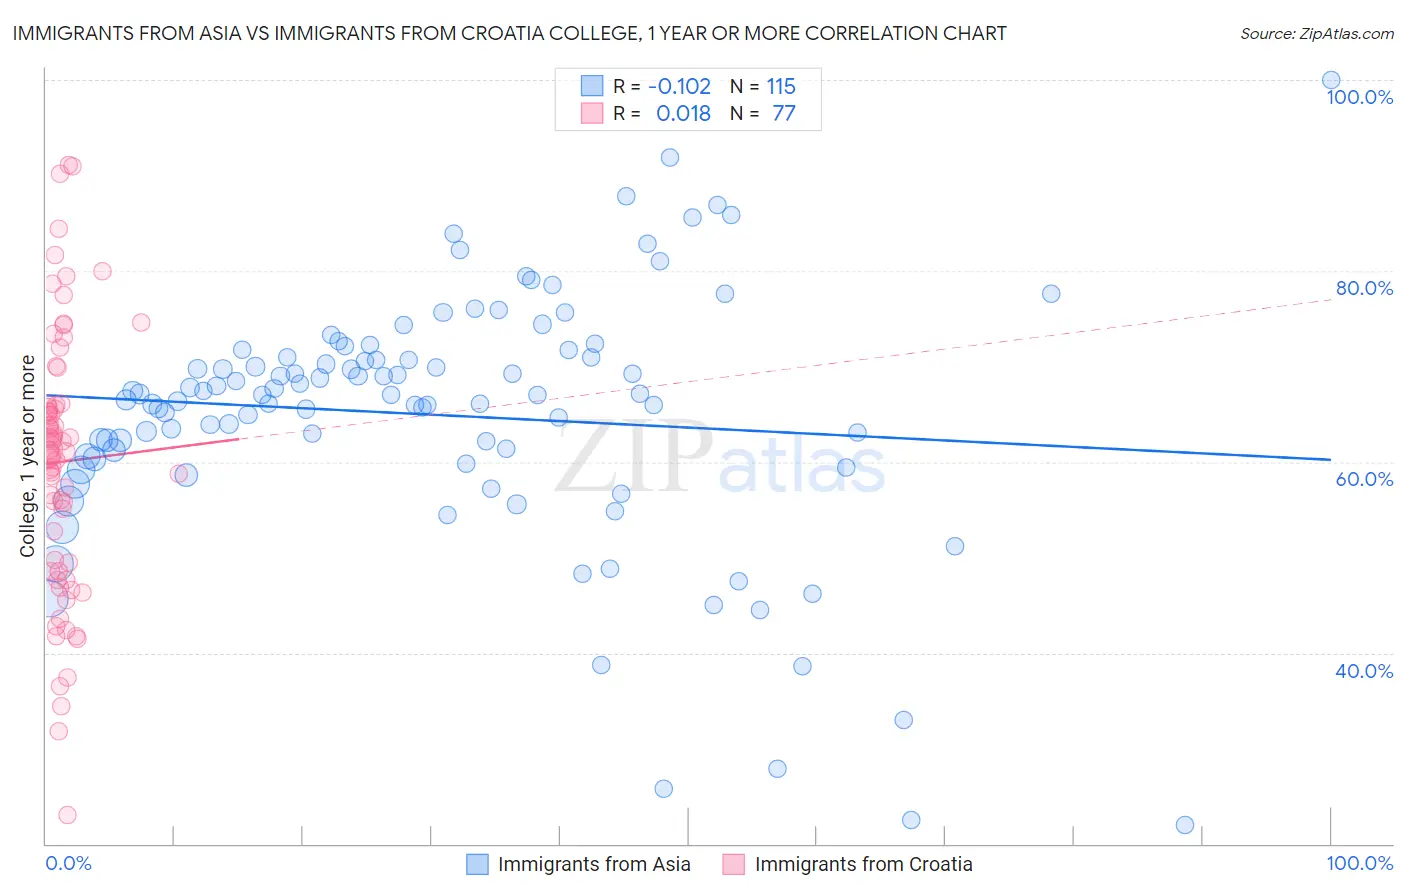
Immigrants from Asia vs Immigrants from Croatia College, 1 year or more Correlation Chart
The statistical analysis conducted on geographies consisting of 549,164,299 people shows a poor negative correlation between the proportion of Immigrants from Asia and percentage of population with at least college, 1 year or more education in the United States with a correlation coefficient (R) of -0.102 and weighted average of 64.0%. Similarly, the statistical analysis conducted on geographies consisting of 132,577,989 people shows no correlation between the proportion of Immigrants from Croatia and percentage of population with at least college, 1 year or more education in the United States with a correlation coefficient (R) of 0.018 and weighted average of 62.3%, a difference of 2.7%.
College, 1 year or more Correlation Summary
| Measurement | Immigrants from Asia | Immigrants from Croatia |
| Minimum | 22.0% | 23.1% |
| Maximum | 100.0% | 91.1% |
| Range | 78.0% | 68.0% |
| Mean | 64.9% | 60.0% |
| Median | 67.0% | 61.2% |
| Interquartile 25% (IQ1) | 60.3% | 49.0% |
| Interquartile 75% (IQ3) | 70.9% | 66.0% |
| Interquartile Range (IQR) | 10.6% | 17.0% |
| Standard Deviation (Sample) | 13.3% | 13.8% |
| Standard Deviation (Population) | 13.3% | 13.7% |
Similar Demographics by College, 1 year or more
Demographics Similar to Immigrants from Asia by College, 1 year or more
In terms of college, 1 year or more, the demographic groups most similar to Immigrants from Asia are South African (64.1%, a difference of 0.14%), Immigrants from Czechoslovakia (64.1%, a difference of 0.15%), Immigrants from Belarus (64.1%, a difference of 0.18%), Zimbabwean (64.2%, a difference of 0.30%), and Asian (64.2%, a difference of 0.33%).
| Demographics | Rating | Rank | College, 1 year or more |
| Immigrants | Malaysia | 99.8 /100 | #51 | Exceptional 64.3% |
| Immigrants | Netherlands | 99.8 /100 | #52 | Exceptional 64.2% |
| Asians | 99.8 /100 | #53 | Exceptional 64.2% |
| Zimbabweans | 99.8 /100 | #54 | Exceptional 64.2% |
| Immigrants | Belarus | 99.7 /100 | #55 | Exceptional 64.1% |
| Immigrants | Czechoslovakia | 99.7 /100 | #56 | Exceptional 64.1% |
| South Africans | 99.7 /100 | #57 | Exceptional 64.1% |
| Immigrants | Asia | 99.7 /100 | #58 | Exceptional 64.0% |
| Immigrants | Serbia | 99.6 /100 | #59 | Exceptional 63.8% |
| Immigrants | Kazakhstan | 99.5 /100 | #60 | Exceptional 63.6% |
| Bolivians | 99.5 /100 | #61 | Exceptional 63.5% |
| Immigrants | Indonesia | 99.5 /100 | #62 | Exceptional 63.5% |
| Immigrants | Scotland | 99.4 /100 | #63 | Exceptional 63.4% |
| Immigrants | Spain | 99.4 /100 | #64 | Exceptional 63.4% |
| Maltese | 99.3 /100 | #65 | Exceptional 63.4% |
Demographics Similar to Immigrants from Croatia by College, 1 year or more
In terms of college, 1 year or more, the demographic groups most similar to Immigrants from Croatia are Romanian (62.4%, a difference of 0.060%), Immigrants from Eastern Europe (62.4%, a difference of 0.090%), Immigrants from Egypt (62.4%, a difference of 0.090%), British (62.3%, a difference of 0.10%), and Immigrants from Western Asia (62.5%, a difference of 0.20%).
| Demographics | Rating | Rank | College, 1 year or more |
| Immigrants | Hungary | 98.6 /100 | #87 | Exceptional 62.7% |
| Greeks | 98.3 /100 | #88 | Exceptional 62.6% |
| Immigrants | Ethiopia | 98.2 /100 | #89 | Exceptional 62.6% |
| Immigrants | Western Asia | 97.9 /100 | #90 | Exceptional 62.5% |
| Immigrants | Eastern Europe | 97.8 /100 | #91 | Exceptional 62.4% |
| Immigrants | Egypt | 97.8 /100 | #92 | Exceptional 62.4% |
| Romanians | 97.7 /100 | #93 | Exceptional 62.4% |
| Immigrants | Croatia | 97.6 /100 | #94 | Exceptional 62.3% |
| British | 97.4 /100 | #95 | Exceptional 62.3% |
| Chinese | 97.2 /100 | #96 | Exceptional 62.2% |
| Jordanians | 97.2 /100 | #97 | Exceptional 62.2% |
| Carpatho Rusyns | 97.2 /100 | #98 | Exceptional 62.2% |
| Croatians | 97.1 /100 | #99 | Exceptional 62.2% |
| Icelanders | 96.8 /100 | #100 | Exceptional 62.1% |
| Swedes | 96.8 /100 | #101 | Exceptional 62.1% |