Immigrants from Cambodia vs Guamanian/Chamorro Associate's Degree
COMPARE
Immigrants from Cambodia
Guamanian/Chamorro
Associate's Degree
Associate's Degree Comparison
Immigrants from Cambodia
Guamanians/Chamorros
42.3%
ASSOCIATE'S DEGREE
0.9/ 100
METRIC RATING
245th/ 347
METRIC RANK
43.8%
ASSOCIATE'S DEGREE
4.8/ 100
METRIC RATING
225th/ 347
METRIC RANK
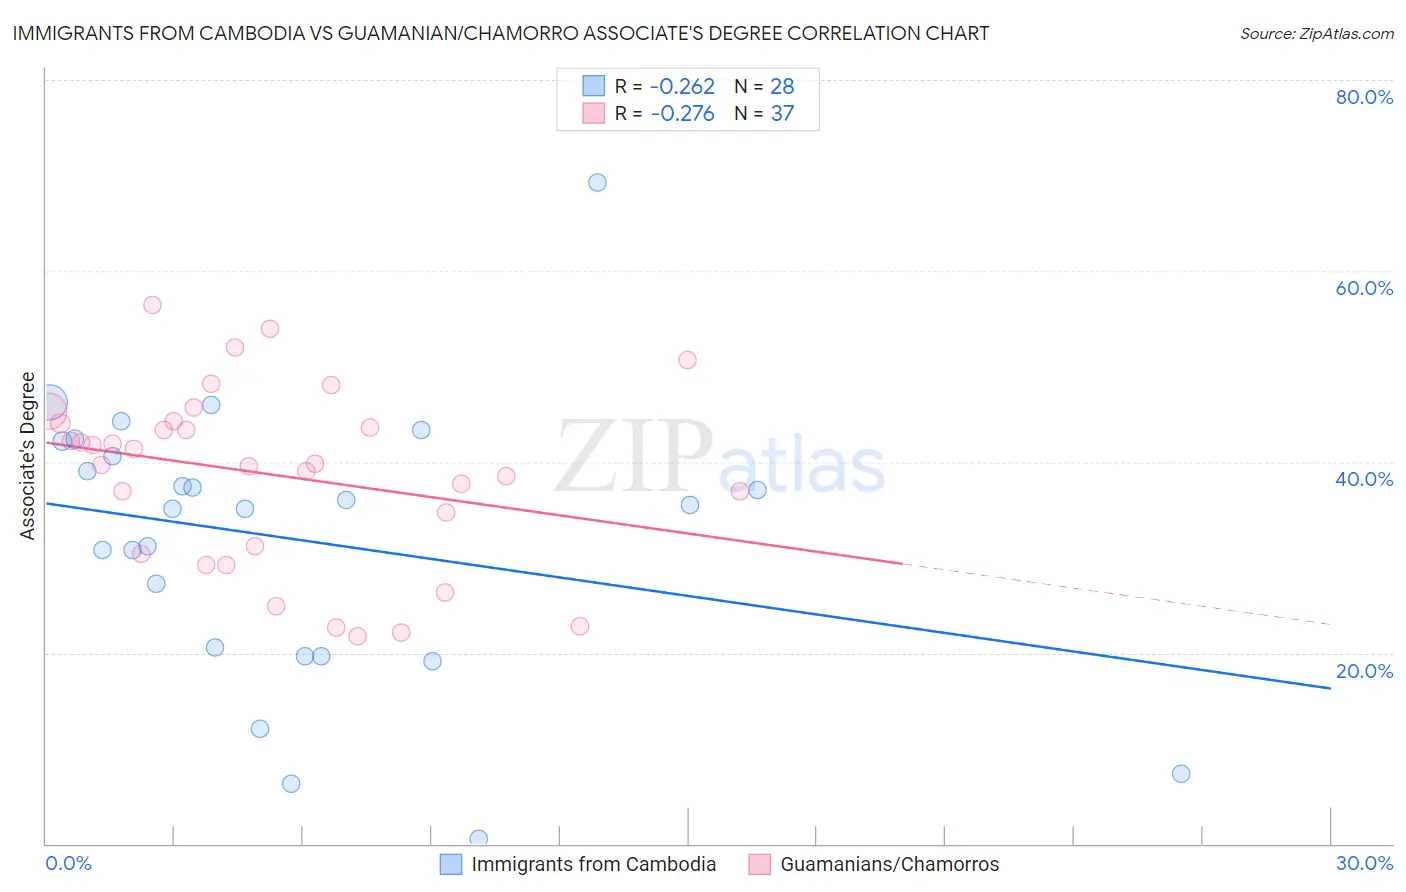
Immigrants from Cambodia vs Guamanian/Chamorro Associate's Degree Correlation Chart
The statistical analysis conducted on geographies consisting of 205,153,213 people shows a weak negative correlation between the proportion of Immigrants from Cambodia and percentage of population with at least associate's degree education in the United States with a correlation coefficient (R) of -0.262 and weighted average of 42.3%. Similarly, the statistical analysis conducted on geographies consisting of 221,965,027 people shows a weak negative correlation between the proportion of Guamanians/Chamorros and percentage of population with at least associate's degree education in the United States with a correlation coefficient (R) of -0.276 and weighted average of 43.8%, a difference of 3.6%.
Associate's Degree Correlation Summary
| Measurement | Immigrants from Cambodia | Guamanian/Chamorro |
| Minimum | 0.50% | 21.7% |
| Maximum | 69.2% | 56.4% |
| Range | 68.7% | 34.7% |
| Mean | 31.9% | 38.7% |
| Median | 35.3% | 39.8% |
| Interquartile 25% (IQ1) | 20.1% | 30.8% |
| Interquartile 75% (IQ3) | 41.4% | 44.1% |
| Interquartile Range (IQR) | 21.2% | 13.4% |
| Standard Deviation (Sample) | 14.7% | 9.2% |
| Standard Deviation (Population) | 14.4% | 9.1% |
Demographics Similar to Immigrants from Cambodia and Guamanians/Chamorros by Associate's Degree
In terms of associate's degree, the demographic groups most similar to Immigrants from Cambodia are Immigrants from Liberia (42.3%, a difference of 0.020%), Guyanese (42.3%, a difference of 0.16%), Immigrants from West Indies (42.4%, a difference of 0.27%), British West Indian (42.4%, a difference of 0.28%), and Cree (42.5%, a difference of 0.62%). Similarly, the demographic groups most similar to Guamanians/Chamorros are Immigrants from Burma/Myanmar (43.7%, a difference of 0.22%), Trinidadian and Tobagonian (43.6%, a difference of 0.39%), Hmong (43.4%, a difference of 0.83%), Immigrants from Trinidad and Tobago (43.3%, a difference of 0.99%), and Immigrants from Barbados (43.3%, a difference of 1.1%).
| Demographics | Rating | Rank | Associate's Degree |
| Guamanians/Chamorros | 4.8 /100 | #225 | Tragic 43.8% |
| Immigrants | Burma/Myanmar | 4.3 /100 | #226 | Tragic 43.7% |
| Trinidadians and Tobagonians | 4.0 /100 | #227 | Tragic 43.6% |
| Hmong | 3.2 /100 | #228 | Tragic 43.4% |
| Immigrants | Trinidad and Tobago | 3.0 /100 | #229 | Tragic 43.3% |
| Immigrants | Barbados | 2.9 /100 | #230 | Tragic 43.3% |
| Liberians | 2.9 /100 | #231 | Tragic 43.3% |
| Native Hawaiians | 2.3 /100 | #232 | Tragic 43.1% |
| Tongans | 2.2 /100 | #233 | Tragic 43.0% |
| Tlingit-Haida | 2.1 /100 | #234 | Tragic 43.0% |
| Ecuadorians | 2.0 /100 | #235 | Tragic 43.0% |
| Immigrants | St. Vincent and the Grenadines | 1.9 /100 | #236 | Tragic 42.9% |
| Immigrants | Nonimmigrants | 1.9 /100 | #237 | Tragic 42.9% |
| Iroquois | 1.7 /100 | #238 | Tragic 42.8% |
| Immigrants | Grenada | 1.3 /100 | #239 | Tragic 42.6% |
| Cree | 1.2 /100 | #240 | Tragic 42.5% |
| British West Indians | 1.0 /100 | #241 | Tragic 42.4% |
| Immigrants | West Indies | 1.0 /100 | #242 | Tragic 42.4% |
| Guyanese | 1.0 /100 | #243 | Tragic 42.3% |
| Immigrants | Liberia | 0.9 /100 | #244 | Tragic 42.3% |
| Immigrants | Cambodia | 0.9 /100 | #245 | Tragic 42.3% |