Immigrants from Guatemala vs Guamanian/Chamorro Associate's Degree
COMPARE
Immigrants from Guatemala
Guamanian/Chamorro
Associate's Degree
Associate's Degree Comparison
Immigrants from Guatemala
Guamanians/Chamorros
38.1%
ASSOCIATE'S DEGREE
0.0/ 100
METRIC RATING
309th/ 347
METRIC RANK
43.8%
ASSOCIATE'S DEGREE
4.8/ 100
METRIC RATING
225th/ 347
METRIC RANK
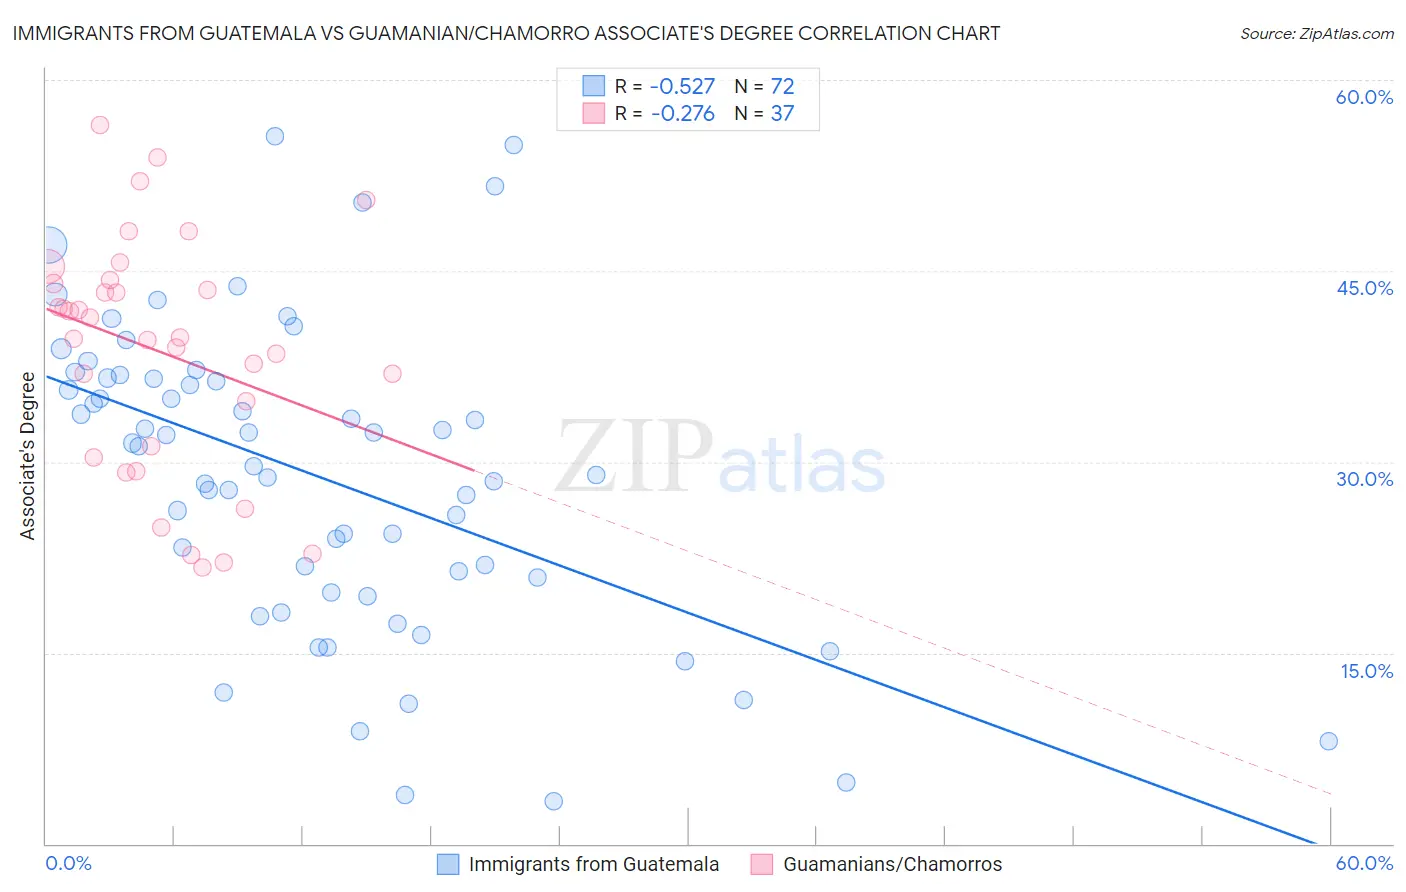
Immigrants from Guatemala vs Guamanian/Chamorro Associate's Degree Correlation Chart
The statistical analysis conducted on geographies consisting of 377,269,409 people shows a substantial negative correlation between the proportion of Immigrants from Guatemala and percentage of population with at least associate's degree education in the United States with a correlation coefficient (R) of -0.527 and weighted average of 38.1%. Similarly, the statistical analysis conducted on geographies consisting of 221,965,027 people shows a weak negative correlation between the proportion of Guamanians/Chamorros and percentage of population with at least associate's degree education in the United States with a correlation coefficient (R) of -0.276 and weighted average of 43.8%, a difference of 14.7%.
Associate's Degree Correlation Summary
| Measurement | Immigrants from Guatemala | Guamanian/Chamorro |
| Minimum | 3.3% | 21.7% |
| Maximum | 55.6% | 56.4% |
| Range | 52.2% | 34.7% |
| Mean | 28.9% | 38.7% |
| Median | 30.4% | 39.8% |
| Interquartile 25% (IQ1) | 20.3% | 30.8% |
| Interquartile 75% (IQ3) | 36.5% | 44.1% |
| Interquartile Range (IQR) | 16.2% | 13.4% |
| Standard Deviation (Sample) | 12.0% | 9.2% |
| Standard Deviation (Population) | 11.9% | 9.1% |
Similar Demographics by Associate's Degree
Demographics Similar to Immigrants from Guatemala by Associate's Degree
In terms of associate's degree, the demographic groups most similar to Immigrants from Guatemala are Mexican American Indian (38.2%, a difference of 0.040%), Immigrants from Dominican Republic (37.9%, a difference of 0.62%), Immigrants from El Salvador (38.4%, a difference of 0.71%), Immigrants from Latin America (37.9%, a difference of 0.73%), and Shoshone (38.4%, a difference of 0.75%).
| Demographics | Rating | Rank | Associate's Degree |
| Colville | 0.0 /100 | #302 | Tragic 38.5% |
| Guatemalans | 0.0 /100 | #303 | Tragic 38.5% |
| Sioux | 0.0 /100 | #304 | Tragic 38.5% |
| Immigrants | Honduras | 0.0 /100 | #305 | Tragic 38.5% |
| Shoshone | 0.0 /100 | #306 | Tragic 38.4% |
| Immigrants | El Salvador | 0.0 /100 | #307 | Tragic 38.4% |
| Mexican American Indians | 0.0 /100 | #308 | Tragic 38.2% |
| Immigrants | Guatemala | 0.0 /100 | #309 | Tragic 38.1% |
| Immigrants | Dominican Republic | 0.0 /100 | #310 | Tragic 37.9% |
| Immigrants | Latin America | 0.0 /100 | #311 | Tragic 37.9% |
| Choctaw | 0.0 /100 | #312 | Tragic 37.8% |
| Hispanics or Latinos | 0.0 /100 | #313 | Tragic 37.7% |
| Seminole | 0.0 /100 | #314 | Tragic 37.7% |
| Creek | 0.0 /100 | #315 | Tragic 37.6% |
| Crow | 0.0 /100 | #316 | Tragic 37.6% |
Demographics Similar to Guamanians/Chamorros by Associate's Degree
In terms of associate's degree, the demographic groups most similar to Guamanians/Chamorros are West Indian (43.8%, a difference of 0.15%), Immigrants from Burma/Myanmar (43.7%, a difference of 0.22%), Subsaharan African (43.9%, a difference of 0.29%), Barbadian (43.9%, a difference of 0.39%), and Trinidadian and Tobagonian (43.6%, a difference of 0.39%).
| Demographics | Rating | Rank | Associate's Degree |
| Spanish | 9.4 /100 | #218 | Tragic 44.4% |
| Whites/Caucasians | 7.5 /100 | #219 | Tragic 44.2% |
| Portuguese | 7.2 /100 | #220 | Tragic 44.1% |
| Immigrants | Western Africa | 6.6 /100 | #221 | Tragic 44.1% |
| Barbadians | 5.8 /100 | #222 | Tragic 43.9% |
| Sub-Saharan Africans | 5.5 /100 | #223 | Tragic 43.9% |
| West Indians | 5.2 /100 | #224 | Tragic 43.8% |
| Guamanians/Chamorros | 4.8 /100 | #225 | Tragic 43.8% |
| Immigrants | Burma/Myanmar | 4.3 /100 | #226 | Tragic 43.7% |
| Trinidadians and Tobagonians | 4.0 /100 | #227 | Tragic 43.6% |
| Hmong | 3.2 /100 | #228 | Tragic 43.4% |
| Immigrants | Trinidad and Tobago | 3.0 /100 | #229 | Tragic 43.3% |
| Immigrants | Barbados | 2.9 /100 | #230 | Tragic 43.3% |
| Liberians | 2.9 /100 | #231 | Tragic 43.3% |
| Native Hawaiians | 2.3 /100 | #232 | Tragic 43.1% |