Immigrants from Zaire vs Trinidadian and Tobagonian Associate's Degree
COMPARE
Immigrants from Zaire
Trinidadian and Tobagonian
Associate's Degree
Associate's Degree Comparison
Immigrants from Zaire
Trinidadians and Tobagonians
45.0%
ASSOCIATE'S DEGREE
16.6/ 100
METRIC RATING
211th/ 347
METRIC RANK
43.6%
ASSOCIATE'S DEGREE
4.0/ 100
METRIC RATING
227th/ 347
METRIC RANK
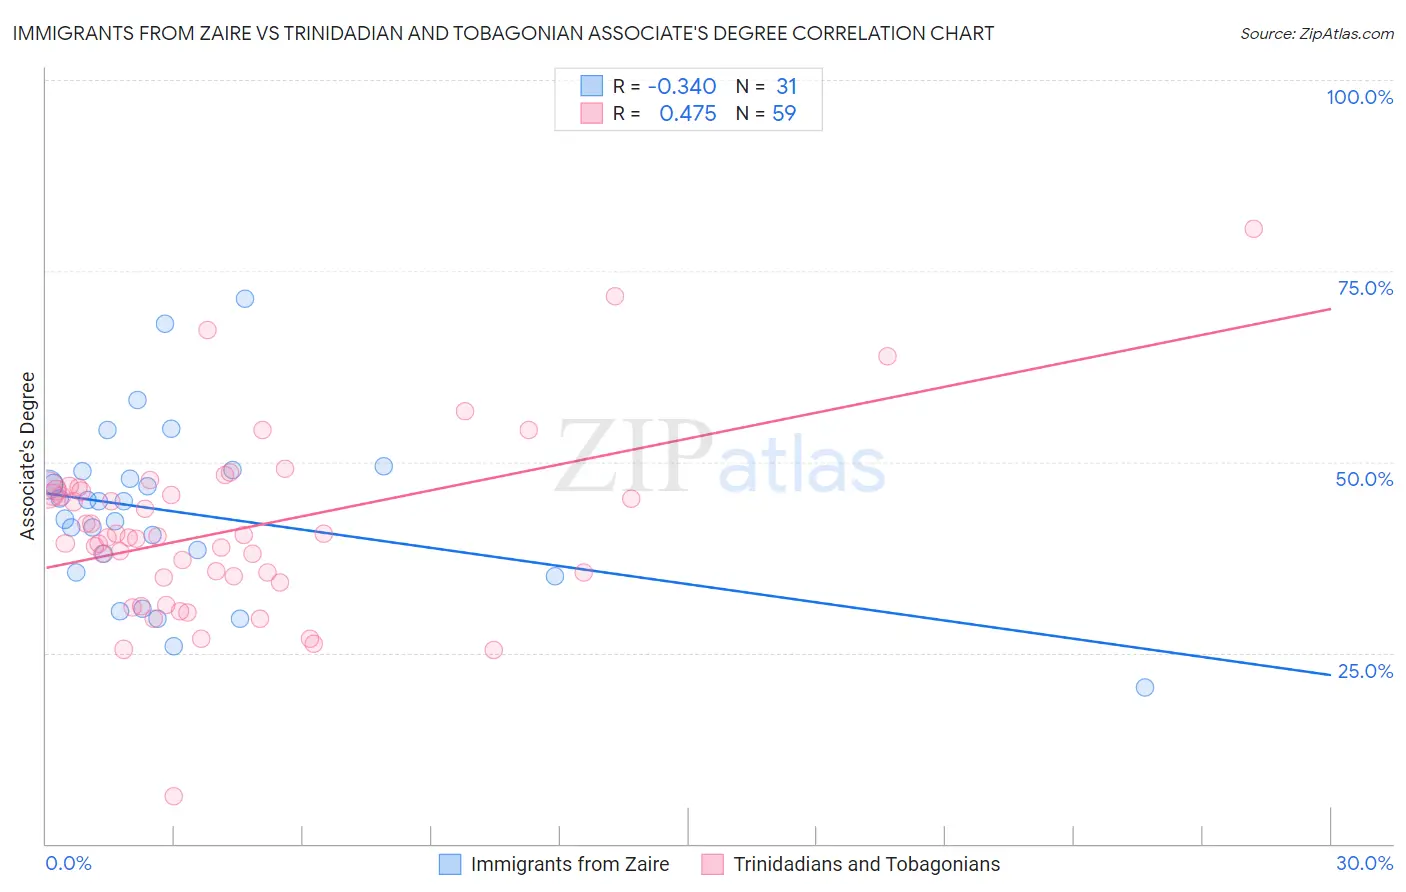
Immigrants from Zaire vs Trinidadian and Tobagonian Associate's Degree Correlation Chart
The statistical analysis conducted on geographies consisting of 107,255,700 people shows a mild negative correlation between the proportion of Immigrants from Zaire and percentage of population with at least associate's degree education in the United States with a correlation coefficient (R) of -0.340 and weighted average of 45.0%. Similarly, the statistical analysis conducted on geographies consisting of 219,861,537 people shows a moderate positive correlation between the proportion of Trinidadians and Tobagonians and percentage of population with at least associate's degree education in the United States with a correlation coefficient (R) of 0.475 and weighted average of 43.6%, a difference of 3.1%.
Associate's Degree Correlation Summary
| Measurement | Immigrants from Zaire | Trinidadian and Tobagonian |
| Minimum | 20.5% | 6.2% |
| Maximum | 71.3% | 80.5% |
| Range | 50.8% | 74.4% |
| Mean | 43.3% | 41.1% |
| Median | 44.8% | 40.2% |
| Interquartile 25% (IQ1) | 35.5% | 34.9% |
| Interquartile 75% (IQ3) | 48.8% | 46.3% |
| Interquartile Range (IQR) | 13.3% | 11.4% |
| Standard Deviation (Sample) | 11.2% | 11.9% |
| Standard Deviation (Population) | 11.0% | 11.8% |
Demographics Similar to Immigrants from Zaire and Trinidadians and Tobagonians by Associate's Degree
In terms of associate's degree, the demographic groups most similar to Immigrants from Zaire are Immigrants from Costa Rica (45.0%, a difference of 0.010%), Immigrants from Philippines (45.0%, a difference of 0.010%), French Canadian (44.9%, a difference of 0.23%), Immigrants from Ghana (44.8%, a difference of 0.35%), and Immigrants from Middle Africa (44.7%, a difference of 0.61%). Similarly, the demographic groups most similar to Trinidadians and Tobagonians are Immigrants from Burma/Myanmar (43.7%, a difference of 0.17%), Guamanian/Chamorro (43.8%, a difference of 0.39%), Hmong (43.4%, a difference of 0.44%), West Indian (43.8%, a difference of 0.54%), and Immigrants from Trinidad and Tobago (43.3%, a difference of 0.60%).
| Demographics | Rating | Rank | Associate's Degree |
| Immigrants | Costa Rica | 16.7 /100 | #209 | Poor 45.0% |
| Immigrants | Philippines | 16.7 /100 | #210 | Poor 45.0% |
| Immigrants | Zaire | 16.6 /100 | #211 | Poor 45.0% |
| French Canadians | 15.0 /100 | #212 | Poor 44.9% |
| Immigrants | Ghana | 14.2 /100 | #213 | Poor 44.8% |
| Immigrants | Middle Africa | 12.7 /100 | #214 | Poor 44.7% |
| Immigrants | Panama | 12.4 /100 | #215 | Poor 44.7% |
| Immigrants | Nigeria | 11.4 /100 | #216 | Poor 44.6% |
| Immigrants | Immigrants | 10.5 /100 | #217 | Poor 44.5% |
| Spanish | 9.4 /100 | #218 | Tragic 44.4% |
| Whites/Caucasians | 7.5 /100 | #219 | Tragic 44.2% |
| Portuguese | 7.2 /100 | #220 | Tragic 44.1% |
| Immigrants | Western Africa | 6.6 /100 | #221 | Tragic 44.1% |
| Barbadians | 5.8 /100 | #222 | Tragic 43.9% |
| Sub-Saharan Africans | 5.5 /100 | #223 | Tragic 43.9% |
| West Indians | 5.2 /100 | #224 | Tragic 43.8% |
| Guamanians/Chamorros | 4.8 /100 | #225 | Tragic 43.8% |
| Immigrants | Burma/Myanmar | 4.3 /100 | #226 | Tragic 43.7% |
| Trinidadians and Tobagonians | 4.0 /100 | #227 | Tragic 43.6% |
| Hmong | 3.2 /100 | #228 | Tragic 43.4% |
| Immigrants | Trinidad and Tobago | 3.0 /100 | #229 | Tragic 43.3% |