Immigrants from Yemen vs Immigrants from Micronesia College, 1 year or more
COMPARE
Immigrants from Yemen
Immigrants from Micronesia
College, 1 year or more
College, 1 year or more Comparison
Immigrants from Yemen
Immigrants from Micronesia
50.0%
COLLEGE, 1 YEAR OR MORE
0.0/ 100
METRIC RATING
331st/ 347
METRIC RANK
54.8%
COLLEGE, 1 YEAR OR MORE
0.3/ 100
METRIC RATING
264th/ 347
METRIC RANK
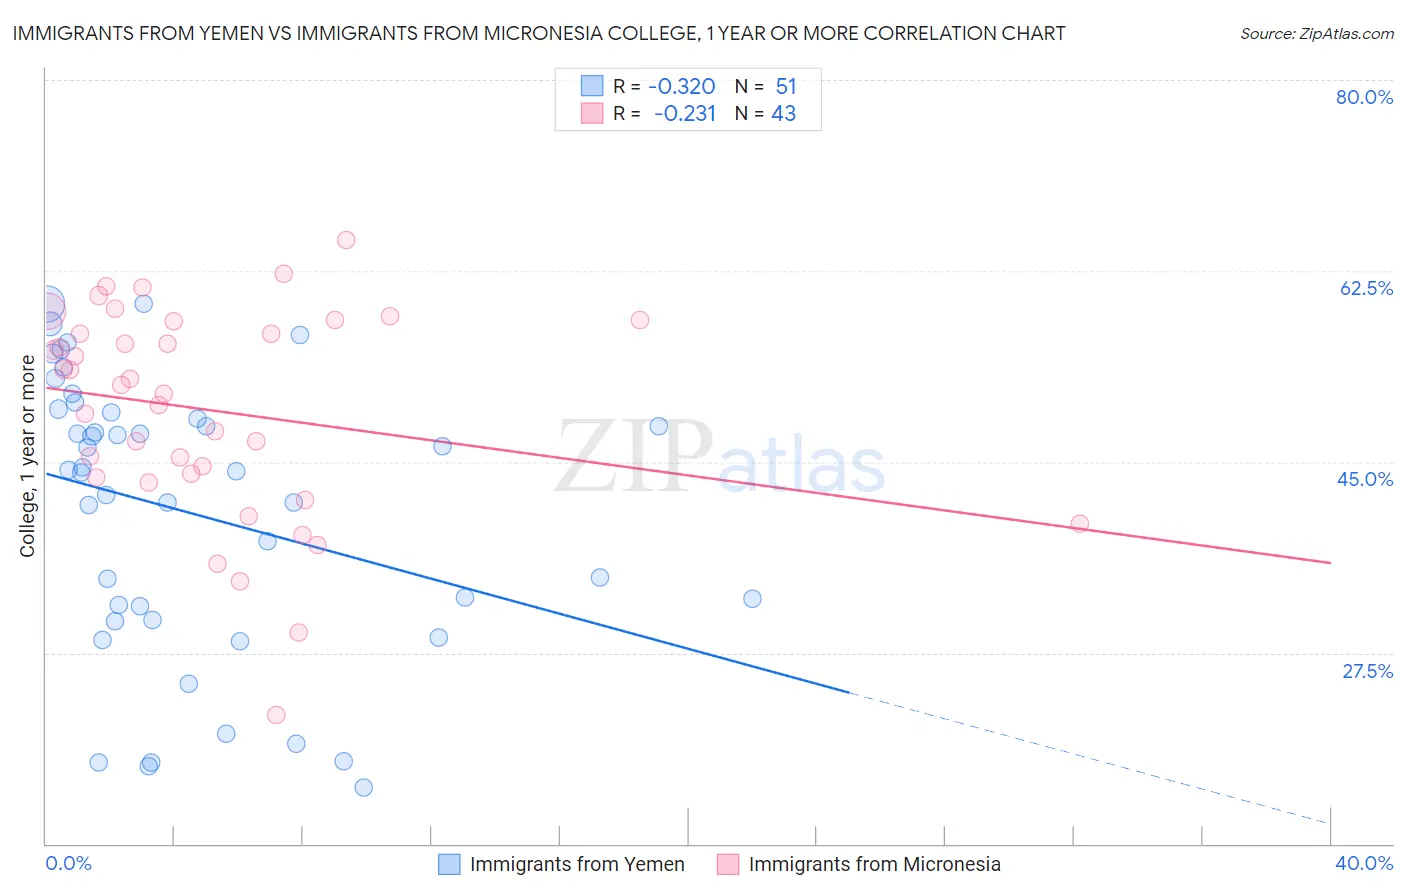
Immigrants from Yemen vs Immigrants from Micronesia College, 1 year or more Correlation Chart
The statistical analysis conducted on geographies consisting of 82,433,611 people shows a mild negative correlation between the proportion of Immigrants from Yemen and percentage of population with at least college, 1 year or more education in the United States with a correlation coefficient (R) of -0.320 and weighted average of 50.0%. Similarly, the statistical analysis conducted on geographies consisting of 61,608,832 people shows a weak negative correlation between the proportion of Immigrants from Micronesia and percentage of population with at least college, 1 year or more education in the United States with a correlation coefficient (R) of -0.231 and weighted average of 54.8%, a difference of 9.5%.
College, 1 year or more Correlation Summary
| Measurement | Immigrants from Yemen | Immigrants from Micronesia |
| Minimum | 15.2% | 21.8% |
| Maximum | 59.5% | 65.3% |
| Range | 44.4% | 43.6% |
| Mean | 40.3% | 49.7% |
| Median | 44.2% | 52.0% |
| Interquartile 25% (IQ1) | 30.5% | 43.6% |
| Interquartile 75% (IQ3) | 49.5% | 57.9% |
| Interquartile Range (IQR) | 19.0% | 14.3% |
| Standard Deviation (Sample) | 12.7% | 9.7% |
| Standard Deviation (Population) | 12.6% | 9.5% |
Similar Demographics by College, 1 year or more
Demographics Similar to Immigrants from Yemen by College, 1 year or more
In terms of college, 1 year or more, the demographic groups most similar to Immigrants from Yemen are Native/Alaskan (50.2%, a difference of 0.35%), Cape Verdean (50.3%, a difference of 0.57%), Dutch West Indian (50.5%, a difference of 0.97%), Menominee (50.6%, a difference of 1.1%), and Dominican (50.6%, a difference of 1.1%).
| Demographics | Rating | Rank | College, 1 year or more |
| Immigrants | Cuba | 0.0 /100 | #324 | Tragic 50.7% |
| Immigrants | Latin America | 0.0 /100 | #325 | Tragic 50.7% |
| Dominicans | 0.0 /100 | #326 | Tragic 50.6% |
| Menominee | 0.0 /100 | #327 | Tragic 50.6% |
| Dutch West Indians | 0.0 /100 | #328 | Tragic 50.5% |
| Cape Verdeans | 0.0 /100 | #329 | Tragic 50.3% |
| Natives/Alaskans | 0.0 /100 | #330 | Tragic 50.2% |
| Immigrants | Yemen | 0.0 /100 | #331 | Tragic 50.0% |
| Mexicans | 0.0 /100 | #332 | Tragic 49.2% |
| Immigrants | Dominican Republic | 0.0 /100 | #333 | Tragic 49.1% |
| Lumbee | 0.0 /100 | #334 | Tragic 48.9% |
| Yuman | 0.0 /100 | #335 | Tragic 48.7% |
| Spanish American Indians | 0.0 /100 | #336 | Tragic 48.5% |
| Pennsylvania Germans | 0.0 /100 | #337 | Tragic 48.5% |
| Immigrants | Central America | 0.0 /100 | #338 | Tragic 48.5% |
Demographics Similar to Immigrants from Micronesia by College, 1 year or more
In terms of college, 1 year or more, the demographic groups most similar to Immigrants from Micronesia are U.S. Virgin Islander (54.8%, a difference of 0.020%), Immigrants from St. Vincent and the Grenadines (54.8%, a difference of 0.050%), Ottawa (54.9%, a difference of 0.13%), Jamaican (54.9%, a difference of 0.16%), and Immigrants from Laos (54.7%, a difference of 0.19%).
| Demographics | Rating | Rank | College, 1 year or more |
| Indonesians | 0.4 /100 | #257 | Tragic 55.1% |
| Africans | 0.4 /100 | #258 | Tragic 55.0% |
| Nepalese | 0.3 /100 | #259 | Tragic 54.9% |
| Jamaicans | 0.3 /100 | #260 | Tragic 54.9% |
| Ottawa | 0.3 /100 | #261 | Tragic 54.9% |
| Immigrants | St. Vincent and the Grenadines | 0.3 /100 | #262 | Tragic 54.8% |
| U.S. Virgin Islanders | 0.3 /100 | #263 | Tragic 54.8% |
| Immigrants | Micronesia | 0.3 /100 | #264 | Tragic 54.8% |
| Immigrants | Laos | 0.2 /100 | #265 | Tragic 54.7% |
| Potawatomi | 0.2 /100 | #266 | Tragic 54.6% |
| Blackfeet | 0.2 /100 | #267 | Tragic 54.6% |
| British West Indians | 0.2 /100 | #268 | Tragic 54.5% |
| Bangladeshis | 0.2 /100 | #269 | Tragic 54.5% |
| Crow | 0.2 /100 | #270 | Tragic 54.5% |
| Bahamians | 0.2 /100 | #271 | Tragic 54.5% |