Immigrants from Yemen vs Immigrants from Morocco College, 1 year or more
COMPARE
Immigrants from Yemen
Immigrants from Morocco
College, 1 year or more
College, 1 year or more Comparison
Immigrants from Yemen
Immigrants from Morocco
50.0%
COLLEGE, 1 YEAR OR MORE
0.0/ 100
METRIC RATING
331st/ 347
METRIC RANK
61.1%
COLLEGE, 1 YEAR OR MORE
89.5/ 100
METRIC RATING
131st/ 347
METRIC RANK
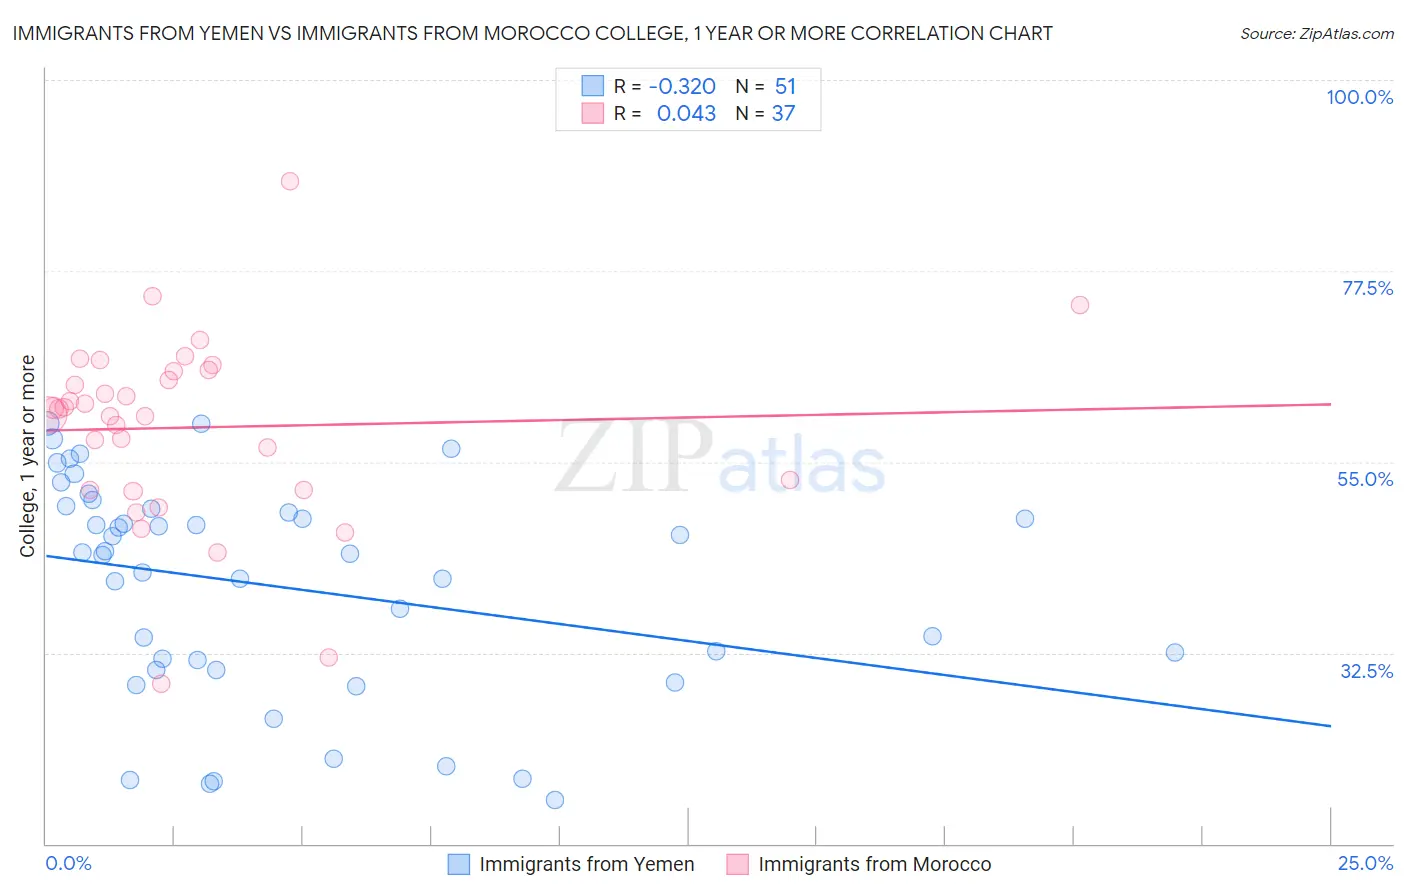
Immigrants from Yemen vs Immigrants from Morocco College, 1 year or more Correlation Chart
The statistical analysis conducted on geographies consisting of 82,433,611 people shows a mild negative correlation between the proportion of Immigrants from Yemen and percentage of population with at least college, 1 year or more education in the United States with a correlation coefficient (R) of -0.320 and weighted average of 50.0%. Similarly, the statistical analysis conducted on geographies consisting of 178,912,438 people shows no correlation between the proportion of Immigrants from Morocco and percentage of population with at least college, 1 year or more education in the United States with a correlation coefficient (R) of 0.043 and weighted average of 61.1%, a difference of 22.1%.
College, 1 year or more Correlation Summary
| Measurement | Immigrants from Yemen | Immigrants from Morocco |
| Minimum | 15.2% | 28.8% |
| Maximum | 59.5% | 88.0% |
| Range | 44.4% | 59.2% |
| Mean | 40.3% | 59.1% |
| Median | 44.2% | 61.2% |
| Interquartile 25% (IQ1) | 30.5% | 51.7% |
| Interquartile 75% (IQ3) | 49.5% | 65.7% |
| Interquartile Range (IQR) | 19.0% | 14.0% |
| Standard Deviation (Sample) | 12.7% | 11.1% |
| Standard Deviation (Population) | 12.6% | 10.9% |
Similar Demographics by College, 1 year or more
Demographics Similar to Immigrants from Yemen by College, 1 year or more
In terms of college, 1 year or more, the demographic groups most similar to Immigrants from Yemen are Native/Alaskan (50.2%, a difference of 0.35%), Cape Verdean (50.3%, a difference of 0.57%), Dutch West Indian (50.5%, a difference of 0.97%), Menominee (50.6%, a difference of 1.1%), and Dominican (50.6%, a difference of 1.1%).
| Demographics | Rating | Rank | College, 1 year or more |
| Immigrants | Cuba | 0.0 /100 | #324 | Tragic 50.7% |
| Immigrants | Latin America | 0.0 /100 | #325 | Tragic 50.7% |
| Dominicans | 0.0 /100 | #326 | Tragic 50.6% |
| Menominee | 0.0 /100 | #327 | Tragic 50.6% |
| Dutch West Indians | 0.0 /100 | #328 | Tragic 50.5% |
| Cape Verdeans | 0.0 /100 | #329 | Tragic 50.3% |
| Natives/Alaskans | 0.0 /100 | #330 | Tragic 50.2% |
| Immigrants | Yemen | 0.0 /100 | #331 | Tragic 50.0% |
| Mexicans | 0.0 /100 | #332 | Tragic 49.2% |
| Immigrants | Dominican Republic | 0.0 /100 | #333 | Tragic 49.1% |
| Lumbee | 0.0 /100 | #334 | Tragic 48.9% |
| Yuman | 0.0 /100 | #335 | Tragic 48.7% |
| Spanish American Indians | 0.0 /100 | #336 | Tragic 48.5% |
| Pennsylvania Germans | 0.0 /100 | #337 | Tragic 48.5% |
| Immigrants | Central America | 0.0 /100 | #338 | Tragic 48.5% |
Demographics Similar to Immigrants from Morocco by College, 1 year or more
In terms of college, 1 year or more, the demographic groups most similar to Immigrants from Morocco are Italian (61.1%, a difference of 0.0%), Scandinavian (61.0%, a difference of 0.16%), Ugandan (61.2%, a difference of 0.18%), Immigrants from Uzbekistan (61.0%, a difference of 0.19%), and Immigrants from Venezuela (61.0%, a difference of 0.21%).
| Demographics | Rating | Rank | College, 1 year or more |
| Venezuelans | 92.1 /100 | #124 | Exceptional 61.3% |
| Immigrants | Syria | 91.6 /100 | #125 | Exceptional 61.3% |
| Alsatians | 91.3 /100 | #126 | Exceptional 61.3% |
| Immigrants | Eastern Africa | 91.1 /100 | #127 | Exceptional 61.2% |
| Immigrants | Italy | 91.1 /100 | #128 | Exceptional 61.2% |
| Ugandans | 90.7 /100 | #129 | Exceptional 61.2% |
| Italians | 89.5 /100 | #130 | Excellent 61.1% |
| Immigrants | Morocco | 89.5 /100 | #131 | Excellent 61.1% |
| Scandinavians | 88.2 /100 | #132 | Excellent 61.0% |
| Immigrants | Uzbekistan | 88.0 /100 | #133 | Excellent 61.0% |
| Immigrants | Venezuela | 87.9 /100 | #134 | Excellent 61.0% |
| Immigrants | Uganda | 87.4 /100 | #135 | Excellent 60.9% |
| Basques | 87.2 /100 | #136 | Excellent 60.9% |
| Slovenes | 86.5 /100 | #137 | Excellent 60.9% |
| Taiwanese | 84.3 /100 | #138 | Excellent 60.7% |