Immigrants from Western Asia vs Guamanian/Chamorro Master's Degree
COMPARE
Immigrants from Western Asia
Guamanian/Chamorro
Master's Degree
Master's Degree Comparison
Immigrants from Western Asia
Guamanians/Chamorros
17.5%
MASTER'S DEGREE
99.5/ 100
METRIC RATING
81st/ 347
METRIC RANK
13.1%
MASTER'S DEGREE
2.2/ 100
METRIC RATING
240th/ 347
METRIC RANK
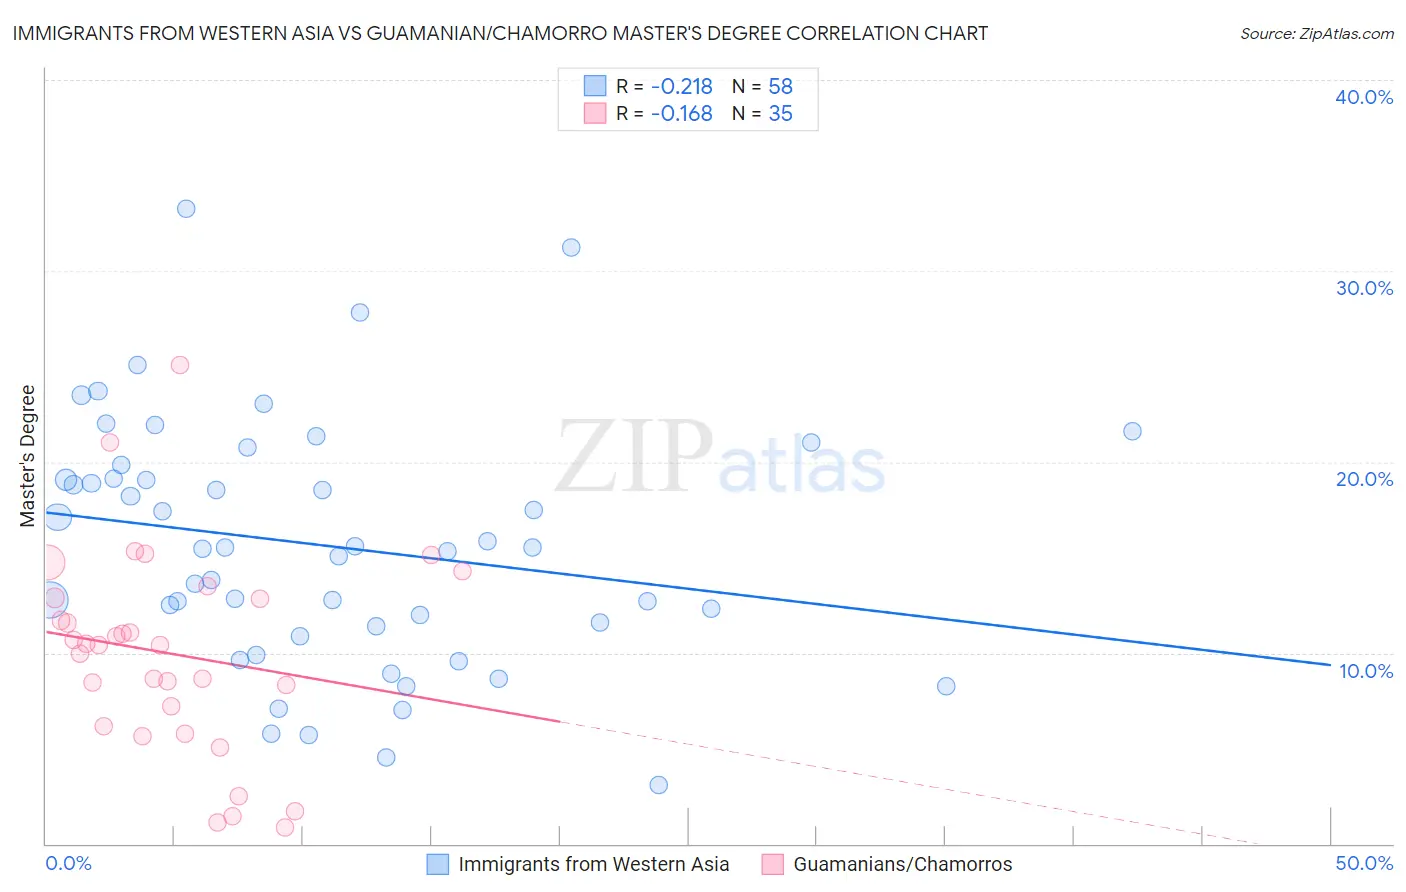
Immigrants from Western Asia vs Guamanian/Chamorro Master's Degree Correlation Chart
The statistical analysis conducted on geographies consisting of 404,328,411 people shows a weak negative correlation between the proportion of Immigrants from Western Asia and percentage of population with at least master's degree education in the United States with a correlation coefficient (R) of -0.218 and weighted average of 17.5%. Similarly, the statistical analysis conducted on geographies consisting of 221,931,951 people shows a poor negative correlation between the proportion of Guamanians/Chamorros and percentage of population with at least master's degree education in the United States with a correlation coefficient (R) of -0.168 and weighted average of 13.1%, a difference of 33.3%.
Master's Degree Correlation Summary
| Measurement | Immigrants from Western Asia | Guamanian/Chamorro |
| Minimum | 3.1% | 0.85% |
| Maximum | 33.2% | 25.0% |
| Range | 30.2% | 24.2% |
| Mean | 15.6% | 9.9% |
| Median | 15.5% | 10.4% |
| Interquartile 25% (IQ1) | 11.4% | 6.1% |
| Interquartile 75% (IQ3) | 19.1% | 12.9% |
| Interquartile Range (IQR) | 7.8% | 6.7% |
| Standard Deviation (Sample) | 6.4% | 5.3% |
| Standard Deviation (Population) | 6.4% | 5.2% |
Similar Demographics by Master's Degree
Demographics Similar to Immigrants from Western Asia by Master's Degree
In terms of master's degree, the demographic groups most similar to Immigrants from Western Asia are Greek (17.5%, a difference of 0.050%), Immigrants from Zimbabwe (17.4%, a difference of 0.11%), Carpatho Rusyn (17.5%, a difference of 0.30%), Immigrants from Lebanon (17.5%, a difference of 0.35%), and Immigrants from Scotland (17.4%, a difference of 0.44%).
| Demographics | Rating | Rank | Master's Degree |
| Immigrants | Romania | 99.7 /100 | #74 | Exceptional 17.7% |
| Egyptians | 99.6 /100 | #75 | Exceptional 17.6% |
| Immigrants | Indonesia | 99.6 /100 | #76 | Exceptional 17.6% |
| Immigrants | Eastern Europe | 99.6 /100 | #77 | Exceptional 17.6% |
| Immigrants | Hungary | 99.6 /100 | #78 | Exceptional 17.5% |
| Immigrants | Lebanon | 99.6 /100 | #79 | Exceptional 17.5% |
| Carpatho Rusyns | 99.6 /100 | #80 | Exceptional 17.5% |
| Immigrants | Western Asia | 99.5 /100 | #81 | Exceptional 17.5% |
| Greeks | 99.5 /100 | #82 | Exceptional 17.5% |
| Immigrants | Zimbabwe | 99.5 /100 | #83 | Exceptional 17.4% |
| Immigrants | Scotland | 99.4 /100 | #84 | Exceptional 17.4% |
| Immigrants | Brazil | 99.4 /100 | #85 | Exceptional 17.4% |
| Immigrants | Croatia | 99.3 /100 | #86 | Exceptional 17.3% |
| Maltese | 99.3 /100 | #87 | Exceptional 17.3% |
| Immigrants | Canada | 99.2 /100 | #88 | Exceptional 17.2% |
Demographics Similar to Guamanians/Chamorros by Master's Degree
In terms of master's degree, the demographic groups most similar to Guamanians/Chamorros are U.S. Virgin Islander (13.1%, a difference of 0.14%), Spanish American (13.0%, a difference of 0.43%), Immigrants from Jamaica (13.0%, a difference of 0.47%), Delaware (13.0%, a difference of 0.85%), and Immigrants from Bahamas (12.9%, a difference of 1.5%).
| Demographics | Rating | Rank | Master's Degree |
| Immigrants | Ecuador | 5.7 /100 | #233 | Tragic 13.6% |
| Immigrants | Burma/Myanmar | 5.0 /100 | #234 | Tragic 13.5% |
| German Russians | 4.5 /100 | #235 | Tragic 13.5% |
| Immigrants | Guyana | 4.4 /100 | #236 | Tragic 13.4% |
| Jamaicans | 4.1 /100 | #237 | Tragic 13.4% |
| Hmong | 4.0 /100 | #238 | Tragic 13.4% |
| Immigrants | Nonimmigrants | 3.4 /100 | #239 | Tragic 13.3% |
| Guamanians/Chamorros | 2.2 /100 | #240 | Tragic 13.1% |
| U.S. Virgin Islanders | 2.1 /100 | #241 | Tragic 13.1% |
| Spanish Americans | 1.9 /100 | #242 | Tragic 13.0% |
| Immigrants | Jamaica | 1.9 /100 | #243 | Tragic 13.0% |
| Delaware | 1.7 /100 | #244 | Tragic 13.0% |
| Immigrants | Bahamas | 1.4 /100 | #245 | Tragic 12.9% |
| Immigrants | Cambodia | 1.4 /100 | #246 | Tragic 12.9% |
| Iroquois | 1.4 /100 | #247 | Tragic 12.9% |