European vs Guamanian/Chamorro Master's Degree
COMPARE
European
Guamanian/Chamorro
Master's Degree
Master's Degree Comparison
Europeans
Guamanians/Chamorros
15.8%
MASTER'S DEGREE
86.4/ 100
METRIC RATING
137th/ 347
METRIC RANK
13.1%
MASTER'S DEGREE
2.2/ 100
METRIC RATING
240th/ 347
METRIC RANK
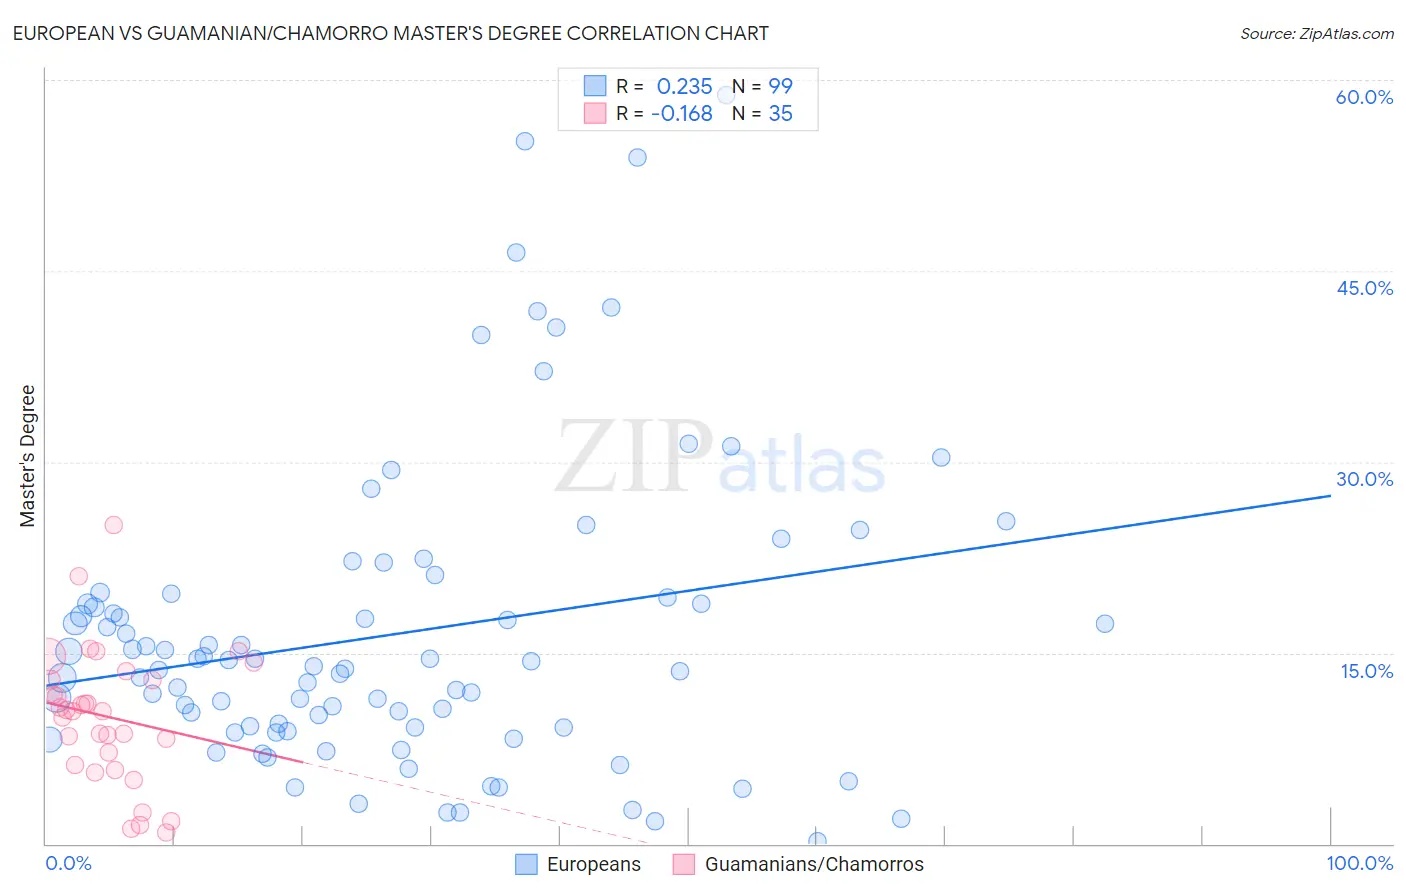
European vs Guamanian/Chamorro Master's Degree Correlation Chart
The statistical analysis conducted on geographies consisting of 561,170,396 people shows a weak positive correlation between the proportion of Europeans and percentage of population with at least master's degree education in the United States with a correlation coefficient (R) of 0.235 and weighted average of 15.8%. Similarly, the statistical analysis conducted on geographies consisting of 221,931,951 people shows a poor negative correlation between the proportion of Guamanians/Chamorros and percentage of population with at least master's degree education in the United States with a correlation coefficient (R) of -0.168 and weighted average of 13.1%, a difference of 20.6%.
Master's Degree Correlation Summary
| Measurement | European | Guamanian/Chamorro |
| Minimum | 0.22% | 0.85% |
| Maximum | 58.8% | 25.0% |
| Range | 58.6% | 24.2% |
| Mean | 16.5% | 9.9% |
| Median | 13.9% | 10.4% |
| Interquartile 25% (IQ1) | 9.1% | 6.1% |
| Interquartile 75% (IQ3) | 19.4% | 12.9% |
| Interquartile Range (IQR) | 10.3% | 6.7% |
| Standard Deviation (Sample) | 11.8% | 5.3% |
| Standard Deviation (Population) | 11.8% | 5.2% |
Similar Demographics by Master's Degree
Demographics Similar to Europeans by Master's Degree
In terms of master's degree, the demographic groups most similar to Europeans are Pakistani (15.8%, a difference of 0.080%), Assyrian/Chaldean/Syriac (15.8%, a difference of 0.10%), Immigrants from Germany (15.8%, a difference of 0.14%), Vietnamese (15.8%, a difference of 0.22%), and Polish (15.7%, a difference of 0.35%).
| Demographics | Rating | Rank | Master's Degree |
| Immigrants | Jordan | 92.7 /100 | #130 | Exceptional 16.1% |
| Taiwanese | 91.9 /100 | #131 | Exceptional 16.1% |
| Serbians | 91.7 /100 | #132 | Exceptional 16.1% |
| Immigrants | Sudan | 90.2 /100 | #133 | Exceptional 16.0% |
| Venezuelans | 88.4 /100 | #134 | Excellent 15.9% |
| South American Indians | 88.4 /100 | #135 | Excellent 15.9% |
| Assyrians/Chaldeans/Syriacs | 86.8 /100 | #136 | Excellent 15.8% |
| Europeans | 86.4 /100 | #137 | Excellent 15.8% |
| Pakistanis | 86.1 /100 | #138 | Excellent 15.8% |
| Immigrants | Germany | 85.9 /100 | #139 | Excellent 15.8% |
| Vietnamese | 85.5 /100 | #140 | Excellent 15.8% |
| Poles | 85.0 /100 | #141 | Excellent 15.7% |
| Immigrants | Africa | 84.0 /100 | #142 | Excellent 15.7% |
| Immigrants | Venezuela | 83.6 /100 | #143 | Excellent 15.7% |
| Canadians | 83.3 /100 | #144 | Excellent 15.7% |
Demographics Similar to Guamanians/Chamorros by Master's Degree
In terms of master's degree, the demographic groups most similar to Guamanians/Chamorros are U.S. Virgin Islander (13.1%, a difference of 0.14%), Spanish American (13.0%, a difference of 0.43%), Immigrants from Jamaica (13.0%, a difference of 0.47%), Delaware (13.0%, a difference of 0.85%), and Immigrants from Bahamas (12.9%, a difference of 1.5%).
| Demographics | Rating | Rank | Master's Degree |
| Immigrants | Ecuador | 5.7 /100 | #233 | Tragic 13.6% |
| Immigrants | Burma/Myanmar | 5.0 /100 | #234 | Tragic 13.5% |
| German Russians | 4.5 /100 | #235 | Tragic 13.5% |
| Immigrants | Guyana | 4.4 /100 | #236 | Tragic 13.4% |
| Jamaicans | 4.1 /100 | #237 | Tragic 13.4% |
| Hmong | 4.0 /100 | #238 | Tragic 13.4% |
| Immigrants | Nonimmigrants | 3.4 /100 | #239 | Tragic 13.3% |
| Guamanians/Chamorros | 2.2 /100 | #240 | Tragic 13.1% |
| U.S. Virgin Islanders | 2.1 /100 | #241 | Tragic 13.1% |
| Spanish Americans | 1.9 /100 | #242 | Tragic 13.0% |
| Immigrants | Jamaica | 1.9 /100 | #243 | Tragic 13.0% |
| Delaware | 1.7 /100 | #244 | Tragic 13.0% |
| Immigrants | Bahamas | 1.4 /100 | #245 | Tragic 12.9% |
| Immigrants | Cambodia | 1.4 /100 | #246 | Tragic 12.9% |
| Iroquois | 1.4 /100 | #247 | Tragic 12.9% |