Puget Sound Salish vs Guamanian/Chamorro Master's Degree
COMPARE
Puget Sound Salish
Guamanian/Chamorro
Master's Degree
Master's Degree Comparison
Puget Sound Salish
Guamanians/Chamorros
11.1%
MASTER'S DEGREE
0.0/ 100
METRIC RATING
309th/ 347
METRIC RANK
13.1%
MASTER'S DEGREE
2.2/ 100
METRIC RATING
240th/ 347
METRIC RANK
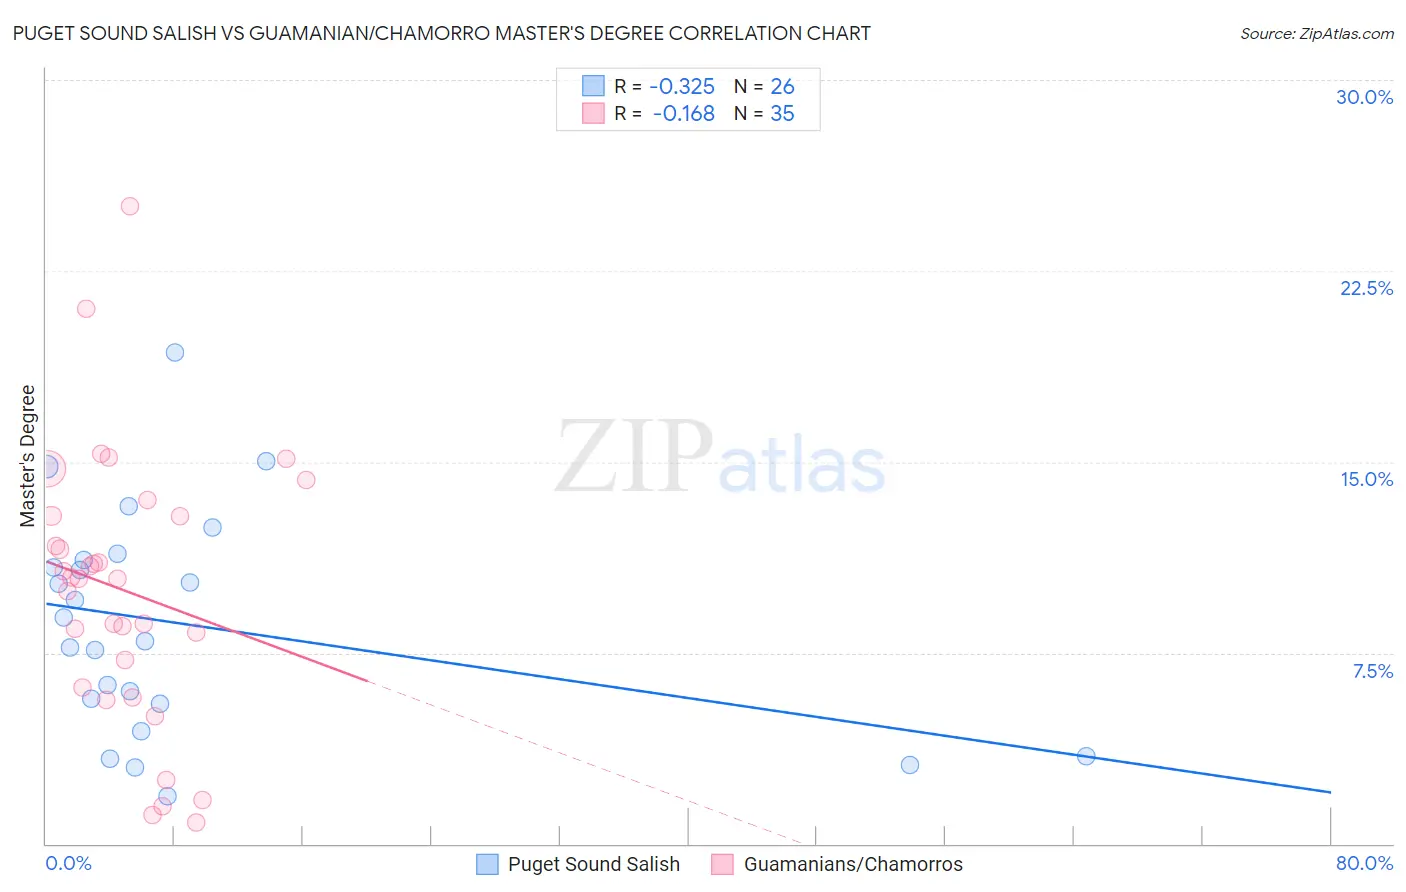
Puget Sound Salish vs Guamanian/Chamorro Master's Degree Correlation Chart
The statistical analysis conducted on geographies consisting of 46,155,292 people shows a mild negative correlation between the proportion of Puget Sound Salish and percentage of population with at least master's degree education in the United States with a correlation coefficient (R) of -0.325 and weighted average of 11.1%. Similarly, the statistical analysis conducted on geographies consisting of 221,931,951 people shows a poor negative correlation between the proportion of Guamanians/Chamorros and percentage of population with at least master's degree education in the United States with a correlation coefficient (R) of -0.168 and weighted average of 13.1%, a difference of 17.6%.
Master's Degree Correlation Summary
| Measurement | Puget Sound Salish | Guamanian/Chamorro |
| Minimum | 1.9% | 0.85% |
| Maximum | 19.3% | 25.0% |
| Range | 17.5% | 24.2% |
| Mean | 8.6% | 9.9% |
| Median | 8.4% | 10.4% |
| Interquartile 25% (IQ1) | 5.5% | 6.1% |
| Interquartile 75% (IQ3) | 11.1% | 12.9% |
| Interquartile Range (IQR) | 5.6% | 6.7% |
| Standard Deviation (Sample) | 4.4% | 5.3% |
| Standard Deviation (Population) | 4.3% | 5.2% |
Similar Demographics by Master's Degree
Demographics Similar to Puget Sound Salish by Master's Degree
In terms of master's degree, the demographic groups most similar to Puget Sound Salish are Puerto Rican (11.2%, a difference of 0.29%), Shoshone (11.1%, a difference of 0.36%), Cheyenne (11.2%, a difference of 0.84%), Seminole (11.0%, a difference of 0.87%), and Choctaw (11.0%, a difference of 0.97%).
| Demographics | Rating | Rank | Master's Degree |
| Cherokee | 0.1 /100 | #302 | Tragic 11.4% |
| Immigrants | Laos | 0.1 /100 | #303 | Tragic 11.4% |
| Immigrants | Cabo Verde | 0.1 /100 | #304 | Tragic 11.3% |
| Immigrants | Latin America | 0.0 /100 | #305 | Tragic 11.3% |
| Mexican American Indians | 0.0 /100 | #306 | Tragic 11.2% |
| Cheyenne | 0.0 /100 | #307 | Tragic 11.2% |
| Puerto Ricans | 0.0 /100 | #308 | Tragic 11.2% |
| Puget Sound Salish | 0.0 /100 | #309 | Tragic 11.1% |
| Shoshone | 0.0 /100 | #310 | Tragic 11.1% |
| Seminole | 0.0 /100 | #311 | Tragic 11.0% |
| Choctaw | 0.0 /100 | #312 | Tragic 11.0% |
| Yaqui | 0.0 /100 | #313 | Tragic 11.0% |
| Cajuns | 0.0 /100 | #314 | Tragic 11.0% |
| Apache | 0.0 /100 | #315 | Tragic 11.0% |
| Hispanics or Latinos | 0.0 /100 | #316 | Tragic 10.9% |
Demographics Similar to Guamanians/Chamorros by Master's Degree
In terms of master's degree, the demographic groups most similar to Guamanians/Chamorros are U.S. Virgin Islander (13.1%, a difference of 0.14%), Spanish American (13.0%, a difference of 0.43%), Immigrants from Jamaica (13.0%, a difference of 0.47%), Delaware (13.0%, a difference of 0.85%), and Immigrants from Bahamas (12.9%, a difference of 1.5%).
| Demographics | Rating | Rank | Master's Degree |
| Immigrants | Ecuador | 5.7 /100 | #233 | Tragic 13.6% |
| Immigrants | Burma/Myanmar | 5.0 /100 | #234 | Tragic 13.5% |
| German Russians | 4.5 /100 | #235 | Tragic 13.5% |
| Immigrants | Guyana | 4.4 /100 | #236 | Tragic 13.4% |
| Jamaicans | 4.1 /100 | #237 | Tragic 13.4% |
| Hmong | 4.0 /100 | #238 | Tragic 13.4% |
| Immigrants | Nonimmigrants | 3.4 /100 | #239 | Tragic 13.3% |
| Guamanians/Chamorros | 2.2 /100 | #240 | Tragic 13.1% |
| U.S. Virgin Islanders | 2.1 /100 | #241 | Tragic 13.1% |
| Spanish Americans | 1.9 /100 | #242 | Tragic 13.0% |
| Immigrants | Jamaica | 1.9 /100 | #243 | Tragic 13.0% |
| Delaware | 1.7 /100 | #244 | Tragic 13.0% |
| Immigrants | Bahamas | 1.4 /100 | #245 | Tragic 12.9% |
| Immigrants | Cambodia | 1.4 /100 | #246 | Tragic 12.9% |
| Iroquois | 1.4 /100 | #247 | Tragic 12.9% |