Immigrants from Western Asia vs Guamanian/Chamorro 12th Grade, No Diploma
COMPARE
Immigrants from Western Asia
Guamanian/Chamorro
12th Grade, No Diploma
12th Grade, No Diploma Comparison
Immigrants from Western Asia
Guamanians/Chamorros
91.2%
12TH GRADE, NO DIPLOMA
49.0/ 100
METRIC RATING
175th/ 347
METRIC RANK
91.0%
12TH GRADE, NO DIPLOMA
39.5/ 100
METRIC RATING
181st/ 347
METRIC RANK
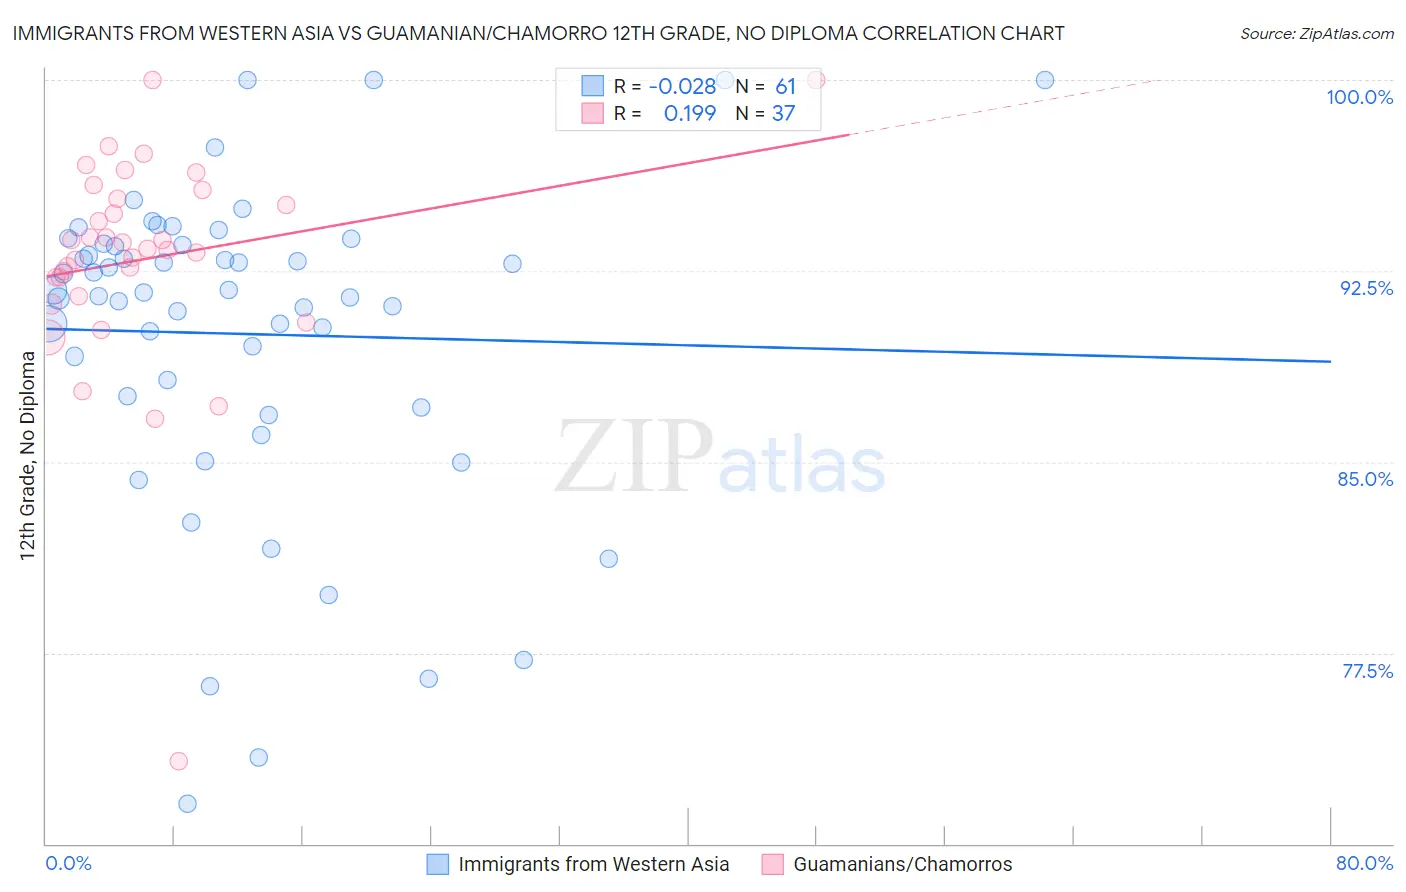
Immigrants from Western Asia vs Guamanian/Chamorro 12th Grade, No Diploma Correlation Chart
The statistical analysis conducted on geographies consisting of 404,433,811 people shows no correlation between the proportion of Immigrants from Western Asia and percentage of population with at least 12th grade (no diploma) education in the United States with a correlation coefficient (R) of -0.028 and weighted average of 91.2%. Similarly, the statistical analysis conducted on geographies consisting of 221,965,618 people shows a poor positive correlation between the proportion of Guamanians/Chamorros and percentage of population with at least 12th grade (no diploma) education in the United States with a correlation coefficient (R) of 0.199 and weighted average of 91.0%, a difference of 0.12%.
12th Grade, No Diploma Correlation Summary
| Measurement | Immigrants from Western Asia | Guamanian/Chamorro |
| Minimum | 71.6% | 73.2% |
| Maximum | 100.0% | 100.0% |
| Range | 28.4% | 26.8% |
| Mean | 90.0% | 93.0% |
| Median | 91.6% | 93.4% |
| Interquartile 25% (IQ1) | 87.4% | 91.9% |
| Interquartile 75% (IQ3) | 93.5% | 95.5% |
| Interquartile Range (IQR) | 6.2% | 3.6% |
| Standard Deviation (Sample) | 6.3% | 4.5% |
| Standard Deviation (Population) | 6.2% | 4.4% |
Demographics Similar to Immigrants from Western Asia and Guamanians/Chamorros by 12th Grade, No Diploma
In terms of 12th grade, no diploma, the demographic groups most similar to Immigrants from Western Asia are Immigrants from Nepal (91.2%, a difference of 0.010%), Iroquois (91.1%, a difference of 0.010%), Bermudan (91.2%, a difference of 0.020%), Bolivian (91.2%, a difference of 0.020%), and Sierra Leonean (91.1%, a difference of 0.020%). Similarly, the demographic groups most similar to Guamanians/Chamorros are Immigrants from Syria (91.1%, a difference of 0.010%), Nonimmigrants (91.0%, a difference of 0.010%), Osage (91.0%, a difference of 0.020%), Spaniard (91.0%, a difference of 0.040%), and Spanish (91.1%, a difference of 0.050%).
| Demographics | Rating | Rank | 12th Grade, No Diploma |
| Cree | 57.0 /100 | #168 | Average 91.2% |
| Immigrants | Indonesia | 54.9 /100 | #169 | Average 91.2% |
| Delaware | 52.8 /100 | #170 | Average 91.2% |
| Immigrants | Morocco | 51.4 /100 | #171 | Average 91.2% |
| Bermudans | 50.8 /100 | #172 | Average 91.2% |
| Bolivians | 50.4 /100 | #173 | Average 91.2% |
| Immigrants | Nepal | 50.0 /100 | #174 | Average 91.2% |
| Immigrants | Western Asia | 49.0 /100 | #175 | Average 91.2% |
| Iroquois | 48.5 /100 | #176 | Average 91.1% |
| Sierra Leoneans | 47.7 /100 | #177 | Average 91.1% |
| Spanish | 43.7 /100 | #178 | Average 91.1% |
| Immigrants | Chile | 43.3 /100 | #179 | Average 91.1% |
| Immigrants | Syria | 40.3 /100 | #180 | Average 91.1% |
| Guamanians/Chamorros | 39.5 /100 | #181 | Fair 91.0% |
| Immigrants | Nonimmigrants | 38.8 /100 | #182 | Fair 91.0% |
| Osage | 38.3 /100 | #183 | Fair 91.0% |
| Spaniards | 36.2 /100 | #184 | Fair 91.0% |
| Sudanese | 34.4 /100 | #185 | Fair 91.0% |
| Ethiopians | 33.9 /100 | #186 | Fair 91.0% |
| Potawatomi | 32.9 /100 | #187 | Fair 91.0% |
| Americans | 32.6 /100 | #188 | Fair 91.0% |