Hawaiian vs Guamanian/Chamorro Master's Degree
COMPARE
Hawaiian
Guamanian/Chamorro
Master's Degree
Master's Degree Comparison
Hawaiians
Guamanians/Chamorros
11.6%
MASTER'S DEGREE
0.1/ 100
METRIC RATING
294th/ 347
METRIC RANK
13.1%
MASTER'S DEGREE
2.2/ 100
METRIC RATING
240th/ 347
METRIC RANK
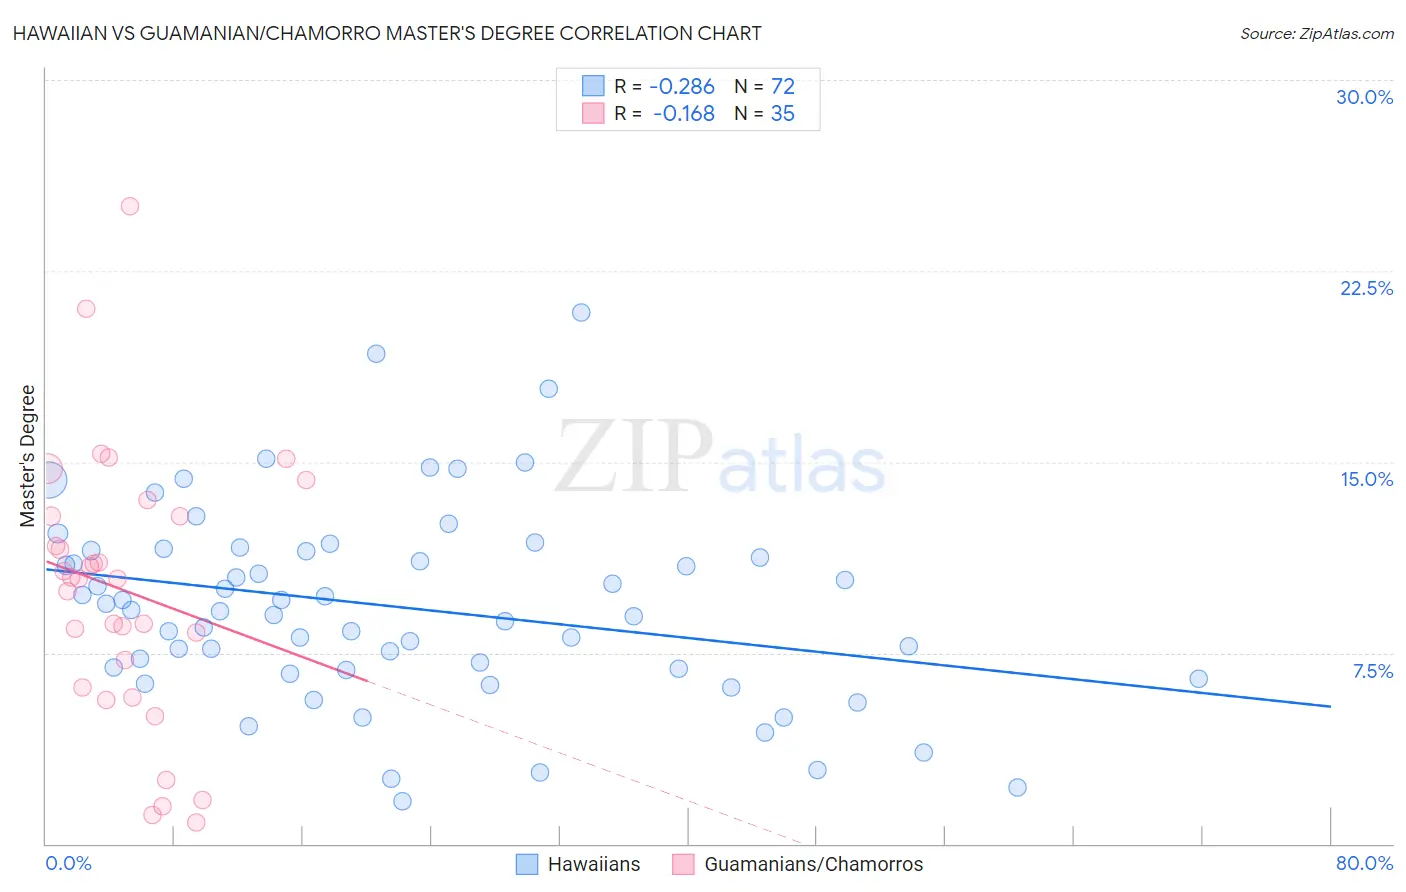
Hawaiian vs Guamanian/Chamorro Master's Degree Correlation Chart
The statistical analysis conducted on geographies consisting of 327,485,009 people shows a weak negative correlation between the proportion of Hawaiians and percentage of population with at least master's degree education in the United States with a correlation coefficient (R) of -0.286 and weighted average of 11.6%. Similarly, the statistical analysis conducted on geographies consisting of 221,931,951 people shows a poor negative correlation between the proportion of Guamanians/Chamorros and percentage of population with at least master's degree education in the United States with a correlation coefficient (R) of -0.168 and weighted average of 13.1%, a difference of 13.0%.
Master's Degree Correlation Summary
| Measurement | Hawaiian | Guamanian/Chamorro |
| Minimum | 1.7% | 0.85% |
| Maximum | 20.9% | 25.0% |
| Range | 19.2% | 24.2% |
| Mean | 9.3% | 9.9% |
| Median | 9.2% | 10.4% |
| Interquartile 25% (IQ1) | 6.8% | 6.1% |
| Interquartile 75% (IQ3) | 11.5% | 12.9% |
| Interquartile Range (IQR) | 4.7% | 6.7% |
| Standard Deviation (Sample) | 3.9% | 5.3% |
| Standard Deviation (Population) | 3.8% | 5.2% |
Similar Demographics by Master's Degree
Demographics Similar to Hawaiians by Master's Degree
In terms of master's degree, the demographic groups most similar to Hawaiians are Alaska Native (11.6%, a difference of 0.10%), Marshallese (11.6%, a difference of 0.15%), Alaskan Athabascan (11.6%, a difference of 0.16%), Immigrants from Yemen (11.6%, a difference of 0.28%), and Immigrants from Guatemala (11.6%, a difference of 0.32%).
| Demographics | Rating | Rank | Master's Degree |
| Immigrants | Haiti | 0.1 /100 | #287 | Tragic 11.8% |
| Immigrants | Honduras | 0.1 /100 | #288 | Tragic 11.8% |
| Guatemalans | 0.1 /100 | #289 | Tragic 11.7% |
| Ute | 0.1 /100 | #290 | Tragic 11.7% |
| Colville | 0.1 /100 | #291 | Tragic 11.6% |
| Immigrants | Guatemala | 0.1 /100 | #292 | Tragic 11.6% |
| Alaska Natives | 0.1 /100 | #293 | Tragic 11.6% |
| Hawaiians | 0.1 /100 | #294 | Tragic 11.6% |
| Marshallese | 0.1 /100 | #295 | Tragic 11.6% |
| Alaskan Athabascans | 0.1 /100 | #296 | Tragic 11.6% |
| Immigrants | Yemen | 0.1 /100 | #297 | Tragic 11.6% |
| Samoans | 0.1 /100 | #298 | Tragic 11.5% |
| Chickasaw | 0.1 /100 | #299 | Tragic 11.4% |
| Chippewa | 0.1 /100 | #300 | Tragic 11.4% |
| Tsimshian | 0.1 /100 | #301 | Tragic 11.4% |
Demographics Similar to Guamanians/Chamorros by Master's Degree
In terms of master's degree, the demographic groups most similar to Guamanians/Chamorros are U.S. Virgin Islander (13.1%, a difference of 0.14%), Spanish American (13.0%, a difference of 0.43%), Immigrants from Jamaica (13.0%, a difference of 0.47%), Delaware (13.0%, a difference of 0.85%), and Immigrants from Bahamas (12.9%, a difference of 1.5%).
| Demographics | Rating | Rank | Master's Degree |
| Immigrants | Ecuador | 5.7 /100 | #233 | Tragic 13.6% |
| Immigrants | Burma/Myanmar | 5.0 /100 | #234 | Tragic 13.5% |
| German Russians | 4.5 /100 | #235 | Tragic 13.5% |
| Immigrants | Guyana | 4.4 /100 | #236 | Tragic 13.4% |
| Jamaicans | 4.1 /100 | #237 | Tragic 13.4% |
| Hmong | 4.0 /100 | #238 | Tragic 13.4% |
| Immigrants | Nonimmigrants | 3.4 /100 | #239 | Tragic 13.3% |
| Guamanians/Chamorros | 2.2 /100 | #240 | Tragic 13.1% |
| U.S. Virgin Islanders | 2.1 /100 | #241 | Tragic 13.1% |
| Spanish Americans | 1.9 /100 | #242 | Tragic 13.0% |
| Immigrants | Jamaica | 1.9 /100 | #243 | Tragic 13.0% |
| Delaware | 1.7 /100 | #244 | Tragic 13.0% |
| Immigrants | Bahamas | 1.4 /100 | #245 | Tragic 12.9% |
| Immigrants | Cambodia | 1.4 /100 | #246 | Tragic 12.9% |
| Iroquois | 1.4 /100 | #247 | Tragic 12.9% |