Immigrants from Cuba vs Guamanian/Chamorro Master's Degree
COMPARE
Immigrants from Cuba
Guamanian/Chamorro
Master's Degree
Master's Degree Comparison
Immigrants from Cuba
Guamanians/Chamorros
10.9%
MASTER'S DEGREE
0.0/ 100
METRIC RATING
318th/ 347
METRIC RANK
13.1%
MASTER'S DEGREE
2.2/ 100
METRIC RATING
240th/ 347
METRIC RANK
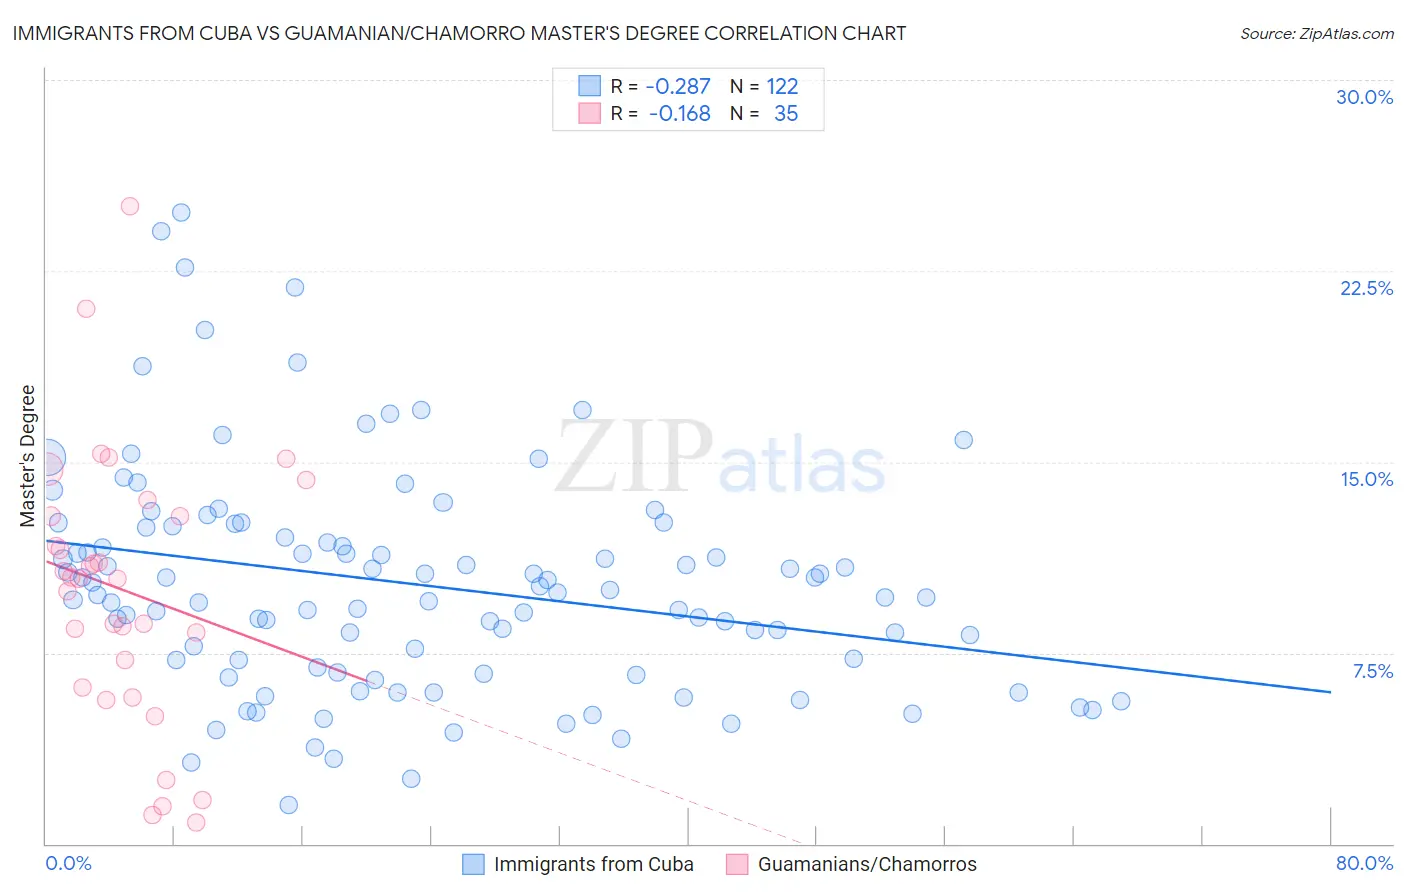
Immigrants from Cuba vs Guamanian/Chamorro Master's Degree Correlation Chart
The statistical analysis conducted on geographies consisting of 325,858,973 people shows a weak negative correlation between the proportion of Immigrants from Cuba and percentage of population with at least master's degree education in the United States with a correlation coefficient (R) of -0.287 and weighted average of 10.9%. Similarly, the statistical analysis conducted on geographies consisting of 221,931,951 people shows a poor negative correlation between the proportion of Guamanians/Chamorros and percentage of population with at least master's degree education in the United States with a correlation coefficient (R) of -0.168 and weighted average of 13.1%, a difference of 20.7%.
Master's Degree Correlation Summary
| Measurement | Immigrants from Cuba | Guamanian/Chamorro |
| Minimum | 1.5% | 0.85% |
| Maximum | 24.8% | 25.0% |
| Range | 23.3% | 24.2% |
| Mean | 10.2% | 9.9% |
| Median | 9.8% | 10.4% |
| Interquartile 25% (IQ1) | 6.9% | 6.1% |
| Interquartile 75% (IQ3) | 12.4% | 12.9% |
| Interquartile Range (IQR) | 5.5% | 6.7% |
| Standard Deviation (Sample) | 4.4% | 5.3% |
| Standard Deviation (Population) | 4.4% | 5.2% |
Similar Demographics by Master's Degree
Demographics Similar to Immigrants from Cuba by Master's Degree
In terms of master's degree, the demographic groups most similar to Immigrants from Cuba are Hopi (10.9%, a difference of 0.13%), Kiowa (10.8%, a difference of 0.24%), Hispanic or Latino (10.9%, a difference of 0.67%), Immigrants from Micronesia (10.8%, a difference of 0.86%), and Cajun (11.0%, a difference of 1.0%).
| Demographics | Rating | Rank | Master's Degree |
| Seminole | 0.0 /100 | #311 | Tragic 11.0% |
| Choctaw | 0.0 /100 | #312 | Tragic 11.0% |
| Yaqui | 0.0 /100 | #313 | Tragic 11.0% |
| Cajuns | 0.0 /100 | #314 | Tragic 11.0% |
| Apache | 0.0 /100 | #315 | Tragic 11.0% |
| Hispanics or Latinos | 0.0 /100 | #316 | Tragic 10.9% |
| Hopi | 0.0 /100 | #317 | Tragic 10.9% |
| Immigrants | Cuba | 0.0 /100 | #318 | Tragic 10.9% |
| Kiowa | 0.0 /100 | #319 | Tragic 10.8% |
| Immigrants | Micronesia | 0.0 /100 | #320 | Tragic 10.8% |
| Pennsylvania Germans | 0.0 /100 | #321 | Tragic 10.7% |
| Sioux | 0.0 /100 | #322 | Tragic 10.7% |
| Crow | 0.0 /100 | #323 | Tragic 10.6% |
| Dutch West Indians | 0.0 /100 | #324 | Tragic 10.6% |
| Inupiat | 0.0 /100 | #325 | Tragic 10.5% |
Demographics Similar to Guamanians/Chamorros by Master's Degree
In terms of master's degree, the demographic groups most similar to Guamanians/Chamorros are U.S. Virgin Islander (13.1%, a difference of 0.14%), Spanish American (13.0%, a difference of 0.43%), Immigrants from Jamaica (13.0%, a difference of 0.47%), Delaware (13.0%, a difference of 0.85%), and Immigrants from Bahamas (12.9%, a difference of 1.5%).
| Demographics | Rating | Rank | Master's Degree |
| Immigrants | Ecuador | 5.7 /100 | #233 | Tragic 13.6% |
| Immigrants | Burma/Myanmar | 5.0 /100 | #234 | Tragic 13.5% |
| German Russians | 4.5 /100 | #235 | Tragic 13.5% |
| Immigrants | Guyana | 4.4 /100 | #236 | Tragic 13.4% |
| Jamaicans | 4.1 /100 | #237 | Tragic 13.4% |
| Hmong | 4.0 /100 | #238 | Tragic 13.4% |
| Immigrants | Nonimmigrants | 3.4 /100 | #239 | Tragic 13.3% |
| Guamanians/Chamorros | 2.2 /100 | #240 | Tragic 13.1% |
| U.S. Virgin Islanders | 2.1 /100 | #241 | Tragic 13.1% |
| Spanish Americans | 1.9 /100 | #242 | Tragic 13.0% |
| Immigrants | Jamaica | 1.9 /100 | #243 | Tragic 13.0% |
| Delaware | 1.7 /100 | #244 | Tragic 13.0% |
| Immigrants | Bahamas | 1.4 /100 | #245 | Tragic 12.9% |
| Immigrants | Cambodia | 1.4 /100 | #246 | Tragic 12.9% |
| Iroquois | 1.4 /100 | #247 | Tragic 12.9% |