Immigrants from West Indies vs Immigrants from Uzbekistan College, Under 1 year
COMPARE
Immigrants from West Indies
Immigrants from Uzbekistan
College, Under 1 year
College, Under 1 year Comparison
Immigrants from West Indies
Immigrants from Uzbekistan
60.6%
COLLEGE, UNDER 1 YEAR
0.1/ 100
METRIC RATING
269th/ 347
METRIC RANK
65.8%
COLLEGE, UNDER 1 YEAR
61.6/ 100
METRIC RATING
165th/ 347
METRIC RANK
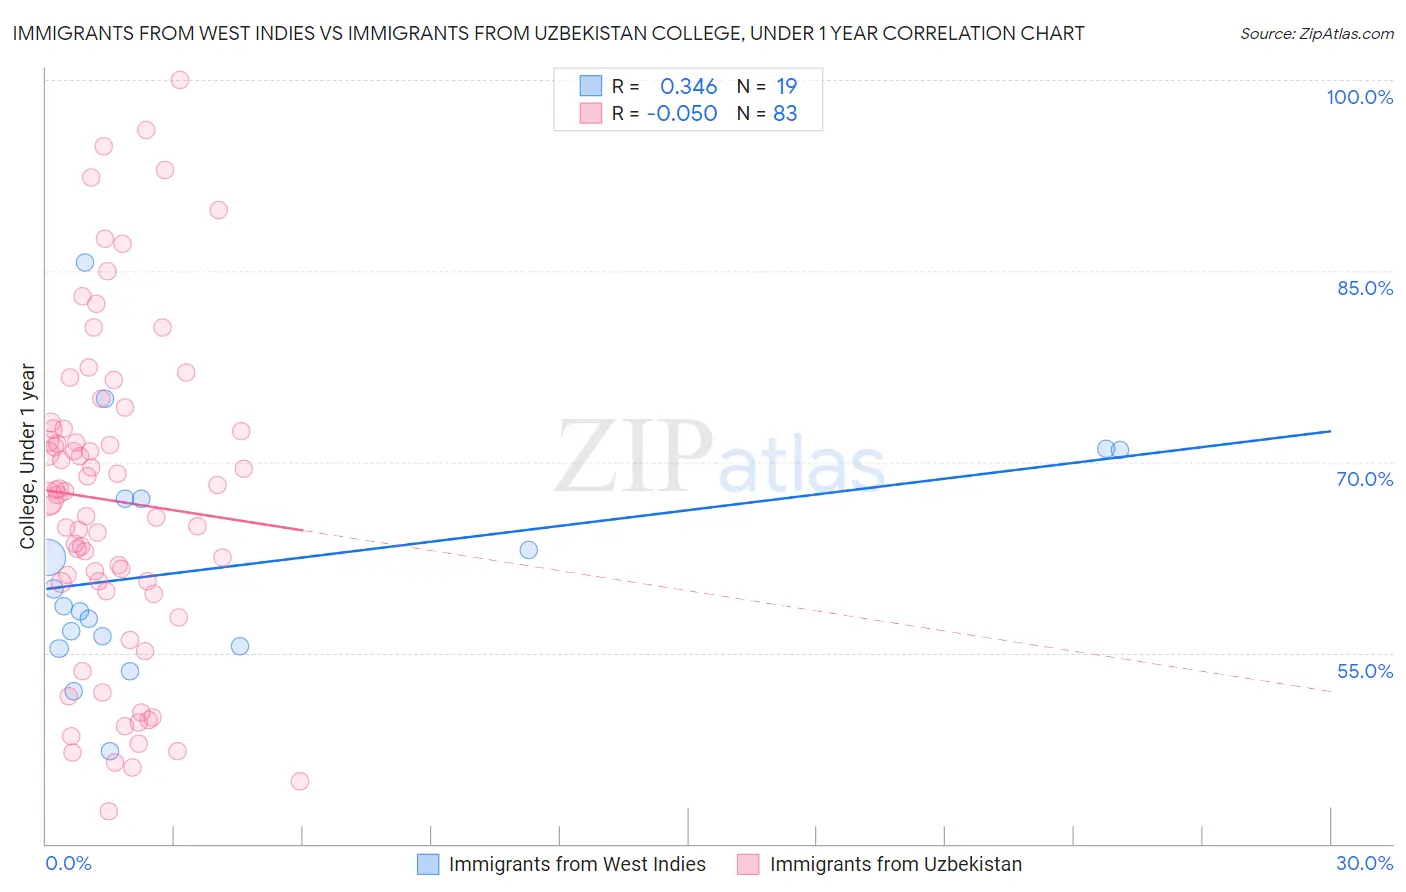
Immigrants from West Indies vs Immigrants from Uzbekistan College, Under 1 year Correlation Chart
The statistical analysis conducted on geographies consisting of 72,457,514 people shows a mild positive correlation between the proportion of Immigrants from West Indies and percentage of population with at least college, under 1 year education in the United States with a correlation coefficient (R) of 0.346 and weighted average of 60.6%. Similarly, the statistical analysis conducted on geographies consisting of 118,765,305 people shows no correlation between the proportion of Immigrants from Uzbekistan and percentage of population with at least college, under 1 year education in the United States with a correlation coefficient (R) of -0.050 and weighted average of 65.8%, a difference of 8.4%.
College, Under 1 year Correlation Summary
| Measurement | Immigrants from West Indies | Immigrants from Uzbekistan |
| Minimum | 47.3% | 42.6% |
| Maximum | 85.6% | 100.0% |
| Range | 38.3% | 57.4% |
| Mean | 61.8% | 67.0% |
| Median | 58.6% | 67.4% |
| Interquartile 25% (IQ1) | 55.5% | 59.9% |
| Interquartile 75% (IQ3) | 67.2% | 72.6% |
| Interquartile Range (IQR) | 11.6% | 12.7% |
| Standard Deviation (Sample) | 9.2% | 12.9% |
| Standard Deviation (Population) | 8.9% | 12.9% |
Similar Demographics by College, Under 1 year
Demographics Similar to Immigrants from West Indies by College, Under 1 year
In terms of college, under 1 year, the demographic groups most similar to Immigrants from West Indies are Cheyenne (60.6%, a difference of 0.11%), Immigrants from Trinidad and Tobago (60.7%, a difference of 0.12%), U.S. Virgin Islander (60.6%, a difference of 0.13%), Jamaican (60.5%, a difference of 0.28%), and Chickasaw (60.4%, a difference of 0.33%).
| Demographics | Rating | Rank | College, Under 1 year |
| Barbadians | 0.2 /100 | #262 | Tragic 61.1% |
| Shoshone | 0.2 /100 | #263 | Tragic 61.1% |
| Trinidadians and Tobagonians | 0.2 /100 | #264 | Tragic 61.1% |
| Immigrants | Bahamas | 0.2 /100 | #265 | Tragic 61.1% |
| Alaskan Athabascans | 0.2 /100 | #266 | Tragic 61.0% |
| Americans | 0.2 /100 | #267 | Tragic 61.0% |
| Immigrants | Trinidad and Tobago | 0.1 /100 | #268 | Tragic 60.7% |
| Immigrants | West Indies | 0.1 /100 | #269 | Tragic 60.6% |
| Cheyenne | 0.1 /100 | #270 | Tragic 60.6% |
| U.S. Virgin Islanders | 0.1 /100 | #271 | Tragic 60.6% |
| Jamaicans | 0.1 /100 | #272 | Tragic 60.5% |
| Chickasaw | 0.1 /100 | #273 | Tragic 60.4% |
| Alaska Natives | 0.1 /100 | #274 | Tragic 60.4% |
| Immigrants | Barbados | 0.1 /100 | #275 | Tragic 60.4% |
| Arapaho | 0.1 /100 | #276 | Tragic 60.3% |
Demographics Similar to Immigrants from Uzbekistan by College, Under 1 year
In terms of college, under 1 year, the demographic groups most similar to Immigrants from Uzbekistan are Somali (65.8%, a difference of 0.050%), Czechoslovakian (65.8%, a difference of 0.050%), Korean (65.9%, a difference of 0.17%), Brazilian (65.9%, a difference of 0.21%), and Albanian (65.9%, a difference of 0.22%).
| Demographics | Rating | Rank | College, Under 1 year |
| Celtics | 67.3 /100 | #158 | Good 65.9% |
| Tlingit-Haida | 66.4 /100 | #159 | Good 65.9% |
| Albanians | 66.1 /100 | #160 | Good 65.9% |
| Brazilians | 66.0 /100 | #161 | Good 65.9% |
| Koreans | 65.3 /100 | #162 | Good 65.9% |
| Somalis | 62.7 /100 | #163 | Good 65.8% |
| Czechoslovakians | 62.6 /100 | #164 | Good 65.8% |
| Immigrants | Uzbekistan | 61.6 /100 | #165 | Good 65.8% |
| Moroccans | 56.7 /100 | #166 | Average 65.6% |
| Immigrants | Somalia | 56.4 /100 | #167 | Average 65.6% |
| Hungarians | 55.9 /100 | #168 | Average 65.6% |
| Yugoslavians | 55.7 /100 | #169 | Average 65.6% |
| Germans | 55.7 /100 | #170 | Average 65.6% |
| Immigrants | Oceania | 55.0 /100 | #171 | Average 65.6% |
| South American Indians | 54.4 /100 | #172 | Average 65.5% |