Immigrants from West Indies vs German Russian College, Under 1 year
COMPARE
Immigrants from West Indies
German Russian
College, Under 1 year
College, Under 1 year Comparison
Immigrants from West Indies
German Russians
60.6%
COLLEGE, UNDER 1 YEAR
0.1/ 100
METRIC RATING
269th/ 347
METRIC RANK
65.4%
COLLEGE, UNDER 1 YEAR
48.3/ 100
METRIC RATING
178th/ 347
METRIC RANK
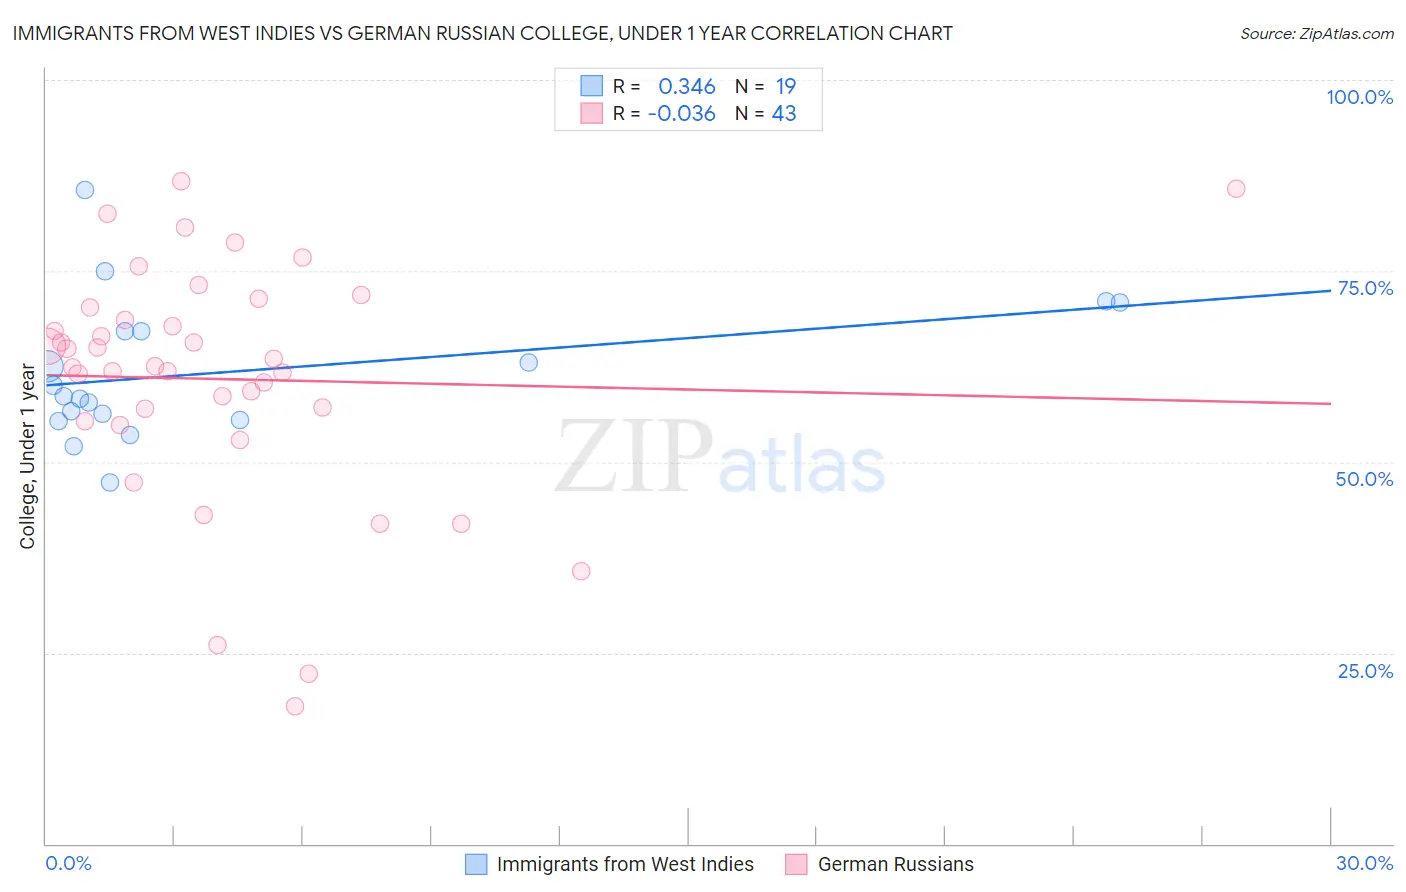
Immigrants from West Indies vs German Russian College, Under 1 year Correlation Chart
The statistical analysis conducted on geographies consisting of 72,457,514 people shows a mild positive correlation between the proportion of Immigrants from West Indies and percentage of population with at least college, under 1 year education in the United States with a correlation coefficient (R) of 0.346 and weighted average of 60.6%. Similarly, the statistical analysis conducted on geographies consisting of 96,461,984 people shows no correlation between the proportion of German Russians and percentage of population with at least college, under 1 year education in the United States with a correlation coefficient (R) of -0.036 and weighted average of 65.4%, a difference of 7.8%.
College, Under 1 year Correlation Summary
| Measurement | Immigrants from West Indies | German Russian |
| Minimum | 47.3% | 18.0% |
| Maximum | 85.6% | 86.7% |
| Range | 38.3% | 68.7% |
| Mean | 61.8% | 60.8% |
| Median | 58.6% | 62.5% |
| Interquartile 25% (IQ1) | 55.5% | 55.4% |
| Interquartile 75% (IQ3) | 67.2% | 70.2% |
| Interquartile Range (IQR) | 11.6% | 14.8% |
| Standard Deviation (Sample) | 9.2% | 15.6% |
| Standard Deviation (Population) | 8.9% | 15.4% |
Similar Demographics by College, Under 1 year
Demographics Similar to Immigrants from West Indies by College, Under 1 year
In terms of college, under 1 year, the demographic groups most similar to Immigrants from West Indies are Cheyenne (60.6%, a difference of 0.11%), Immigrants from Trinidad and Tobago (60.7%, a difference of 0.12%), U.S. Virgin Islander (60.6%, a difference of 0.13%), Jamaican (60.5%, a difference of 0.28%), and Chickasaw (60.4%, a difference of 0.33%).
| Demographics | Rating | Rank | College, Under 1 year |
| Barbadians | 0.2 /100 | #262 | Tragic 61.1% |
| Shoshone | 0.2 /100 | #263 | Tragic 61.1% |
| Trinidadians and Tobagonians | 0.2 /100 | #264 | Tragic 61.1% |
| Immigrants | Bahamas | 0.2 /100 | #265 | Tragic 61.1% |
| Alaskan Athabascans | 0.2 /100 | #266 | Tragic 61.0% |
| Americans | 0.2 /100 | #267 | Tragic 61.0% |
| Immigrants | Trinidad and Tobago | 0.1 /100 | #268 | Tragic 60.7% |
| Immigrants | West Indies | 0.1 /100 | #269 | Tragic 60.6% |
| Cheyenne | 0.1 /100 | #270 | Tragic 60.6% |
| U.S. Virgin Islanders | 0.1 /100 | #271 | Tragic 60.6% |
| Jamaicans | 0.1 /100 | #272 | Tragic 60.5% |
| Chickasaw | 0.1 /100 | #273 | Tragic 60.4% |
| Alaska Natives | 0.1 /100 | #274 | Tragic 60.4% |
| Immigrants | Barbados | 0.1 /100 | #275 | Tragic 60.4% |
| Arapaho | 0.1 /100 | #276 | Tragic 60.3% |
Demographics Similar to German Russians by College, Under 1 year
In terms of college, under 1 year, the demographic groups most similar to German Russians are Guamanian/Chamorro (65.4%, a difference of 0.0%), Immigrants from North Macedonia (65.4%, a difference of 0.010%), French (65.4%, a difference of 0.030%), Scotch-Irish (65.4%, a difference of 0.050%), and Immigrants from Bosnia and Herzegovina (65.4%, a difference of 0.080%).
| Demographics | Rating | Rank | College, Under 1 year |
| Immigrants | Oceania | 55.0 /100 | #171 | Average 65.6% |
| South American Indians | 54.4 /100 | #172 | Average 65.5% |
| Swiss | 53.9 /100 | #173 | Average 65.5% |
| Immigrants | Bosnia and Herzegovina | 50.0 /100 | #174 | Average 65.4% |
| Scotch-Irish | 49.5 /100 | #175 | Average 65.4% |
| French | 48.9 /100 | #176 | Average 65.4% |
| Immigrants | North Macedonia | 48.6 /100 | #177 | Average 65.4% |
| German Russians | 48.3 /100 | #178 | Average 65.4% |
| Guamanians/Chamorros | 48.2 /100 | #179 | Average 65.4% |
| Dutch | 46.1 /100 | #180 | Average 65.3% |
| Spaniards | 45.5 /100 | #181 | Average 65.3% |
| Immigrants | Africa | 44.7 /100 | #182 | Average 65.3% |
| Immigrants | Poland | 42.6 /100 | #183 | Average 65.2% |
| Bermudans | 42.0 /100 | #184 | Average 65.2% |
| Sri Lankans | 41.7 /100 | #185 | Average 65.2% |