Immigrants from Venezuela vs Australian College, Under 1 year
COMPARE
Immigrants from Venezuela
Australian
College, Under 1 year
College, Under 1 year Comparison
Immigrants from Venezuela
Australians
66.3%
COLLEGE, UNDER 1 YEAR
77.9/ 100
METRIC RATING
149th/ 347
METRIC RANK
70.4%
COLLEGE, UNDER 1 YEAR
99.9/ 100
METRIC RATING
38th/ 347
METRIC RANK
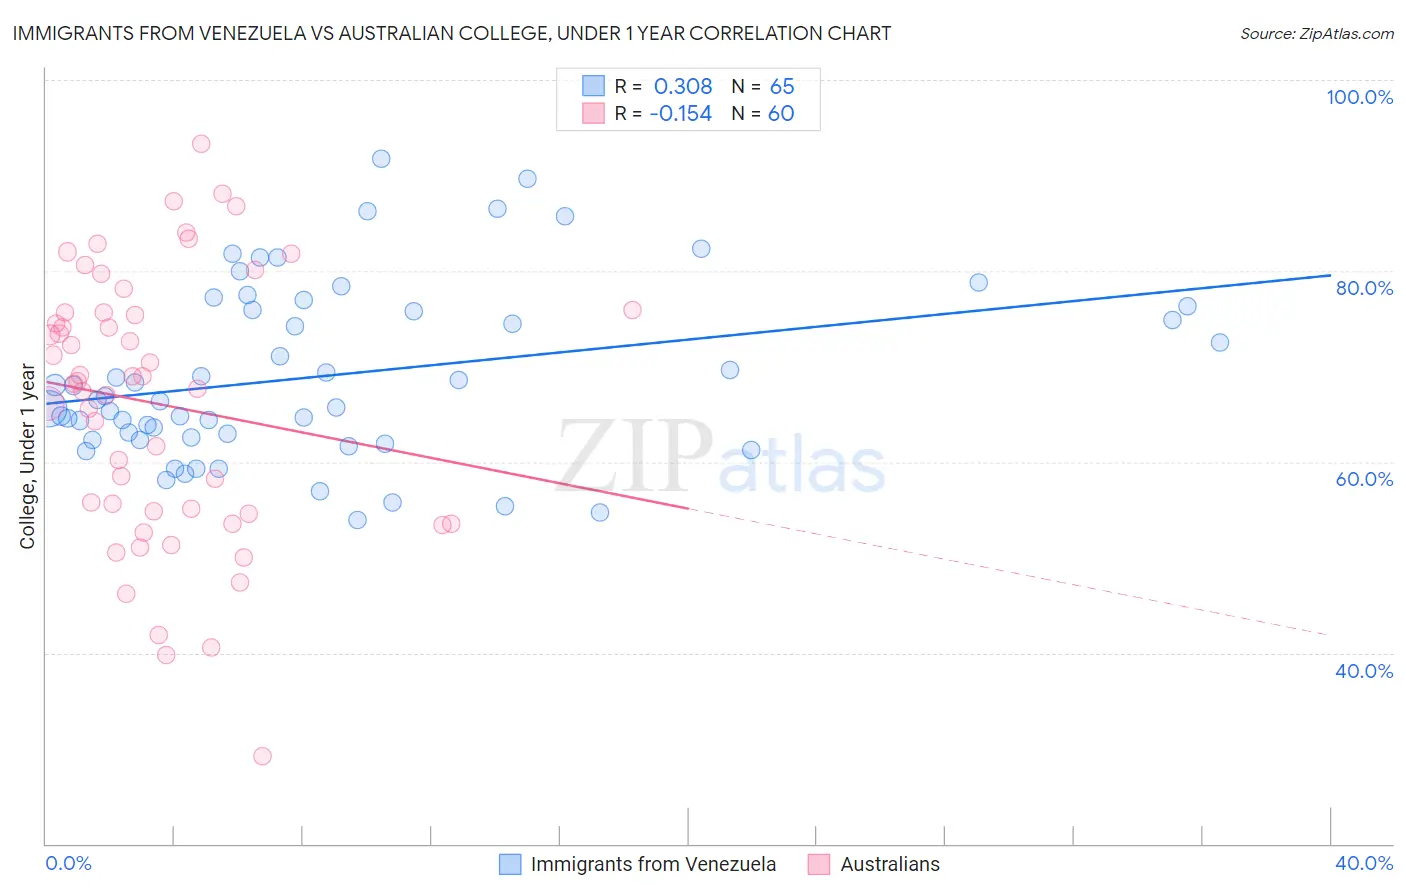
Immigrants from Venezuela vs Australian College, Under 1 year Correlation Chart
The statistical analysis conducted on geographies consisting of 287,866,009 people shows a mild positive correlation between the proportion of Immigrants from Venezuela and percentage of population with at least college, under 1 year education in the United States with a correlation coefficient (R) of 0.308 and weighted average of 66.3%. Similarly, the statistical analysis conducted on geographies consisting of 224,162,526 people shows a poor negative correlation between the proportion of Australians and percentage of population with at least college, under 1 year education in the United States with a correlation coefficient (R) of -0.154 and weighted average of 70.4%, a difference of 6.1%.
College, Under 1 year Correlation Summary
| Measurement | Immigrants from Venezuela | Australian |
| Minimum | 53.8% | 29.1% |
| Maximum | 91.7% | 93.4% |
| Range | 37.9% | 64.2% |
| Mean | 69.0% | 66.0% |
| Median | 66.5% | 68.3% |
| Interquartile 25% (IQ1) | 62.4% | 54.7% |
| Interquartile 75% (IQ3) | 76.1% | 75.6% |
| Interquartile Range (IQR) | 13.7% | 21.0% |
| Standard Deviation (Sample) | 9.2% | 14.0% |
| Standard Deviation (Population) | 9.1% | 13.8% |
Similar Demographics by College, Under 1 year
Demographics Similar to Immigrants from Venezuela by College, Under 1 year
In terms of college, under 1 year, the demographic groups most similar to Immigrants from Venezuela are Taiwanese (66.4%, a difference of 0.040%), Immigrants from Iraq (66.3%, a difference of 0.050%), Immigrants from Sudan (66.2%, a difference of 0.12%), Sudanese (66.2%, a difference of 0.23%), and Immigrants from Morocco (66.5%, a difference of 0.25%).
| Demographics | Rating | Rank | College, Under 1 year |
| English | 82.9 /100 | #142 | Excellent 66.6% |
| Immigrants | Uganda | 82.8 /100 | #143 | Excellent 66.5% |
| Immigrants | Germany | 82.0 /100 | #144 | Excellent 66.5% |
| Immigrants | Kenya | 81.8 /100 | #145 | Excellent 66.5% |
| Kenyans | 81.7 /100 | #146 | Excellent 66.5% |
| Immigrants | Morocco | 81.7 /100 | #147 | Excellent 66.5% |
| Taiwanese | 78.6 /100 | #148 | Good 66.4% |
| Immigrants | Venezuela | 77.9 /100 | #149 | Good 66.3% |
| Immigrants | Iraq | 77.1 /100 | #150 | Good 66.3% |
| Immigrants | Sudan | 76.0 /100 | #151 | Good 66.2% |
| Sudanese | 74.1 /100 | #152 | Good 66.2% |
| Belgians | 73.7 /100 | #153 | Good 66.2% |
| Immigrants | Eritrea | 71.9 /100 | #154 | Good 66.1% |
| Irish | 70.3 /100 | #155 | Good 66.0% |
| Welsh | 69.9 /100 | #156 | Good 66.0% |
Demographics Similar to Australians by College, Under 1 year
In terms of college, under 1 year, the demographic groups most similar to Australians are Bhutanese (70.3%, a difference of 0.020%), Immigrants from Turkey (70.3%, a difference of 0.030%), Immigrants from Saudi Arabia (70.4%, a difference of 0.070%), Immigrants from Kuwait (70.3%, a difference of 0.070%), and Immigrants from Lithuania (70.3%, a difference of 0.11%).
| Demographics | Rating | Rank | College, Under 1 year |
| Indians (Asian) | 99.9 /100 | #31 | Exceptional 70.8% |
| Turks | 99.9 /100 | #32 | Exceptional 70.7% |
| Immigrants | South Africa | 99.9 /100 | #33 | Exceptional 70.6% |
| Estonians | 99.9 /100 | #34 | Exceptional 70.6% |
| Russians | 99.9 /100 | #35 | Exceptional 70.5% |
| Immigrants | Sri Lanka | 99.9 /100 | #36 | Exceptional 70.5% |
| Immigrants | Saudi Arabia | 99.9 /100 | #37 | Exceptional 70.4% |
| Australians | 99.9 /100 | #38 | Exceptional 70.4% |
| Bhutanese | 99.9 /100 | #39 | Exceptional 70.3% |
| Immigrants | Turkey | 99.9 /100 | #40 | Exceptional 70.3% |
| Immigrants | Kuwait | 99.9 /100 | #41 | Exceptional 70.3% |
| Immigrants | Lithuania | 99.9 /100 | #42 | Exceptional 70.3% |
| Israelis | 99.9 /100 | #43 | Exceptional 70.2% |
| New Zealanders | 99.9 /100 | #44 | Exceptional 70.2% |
| Immigrants | Norway | 99.9 /100 | #45 | Exceptional 70.2% |