Immigrants from Venezuela vs Nigerian College, Under 1 year
COMPARE
Immigrants from Venezuela
Nigerian
College, Under 1 year
College, Under 1 year Comparison
Immigrants from Venezuela
Nigerians
66.3%
COLLEGE, UNDER 1 YEAR
77.9/ 100
METRIC RATING
149th/ 347
METRIC RANK
64.3%
COLLEGE, UNDER 1 YEAR
16.7/ 100
METRIC RATING
200th/ 347
METRIC RANK
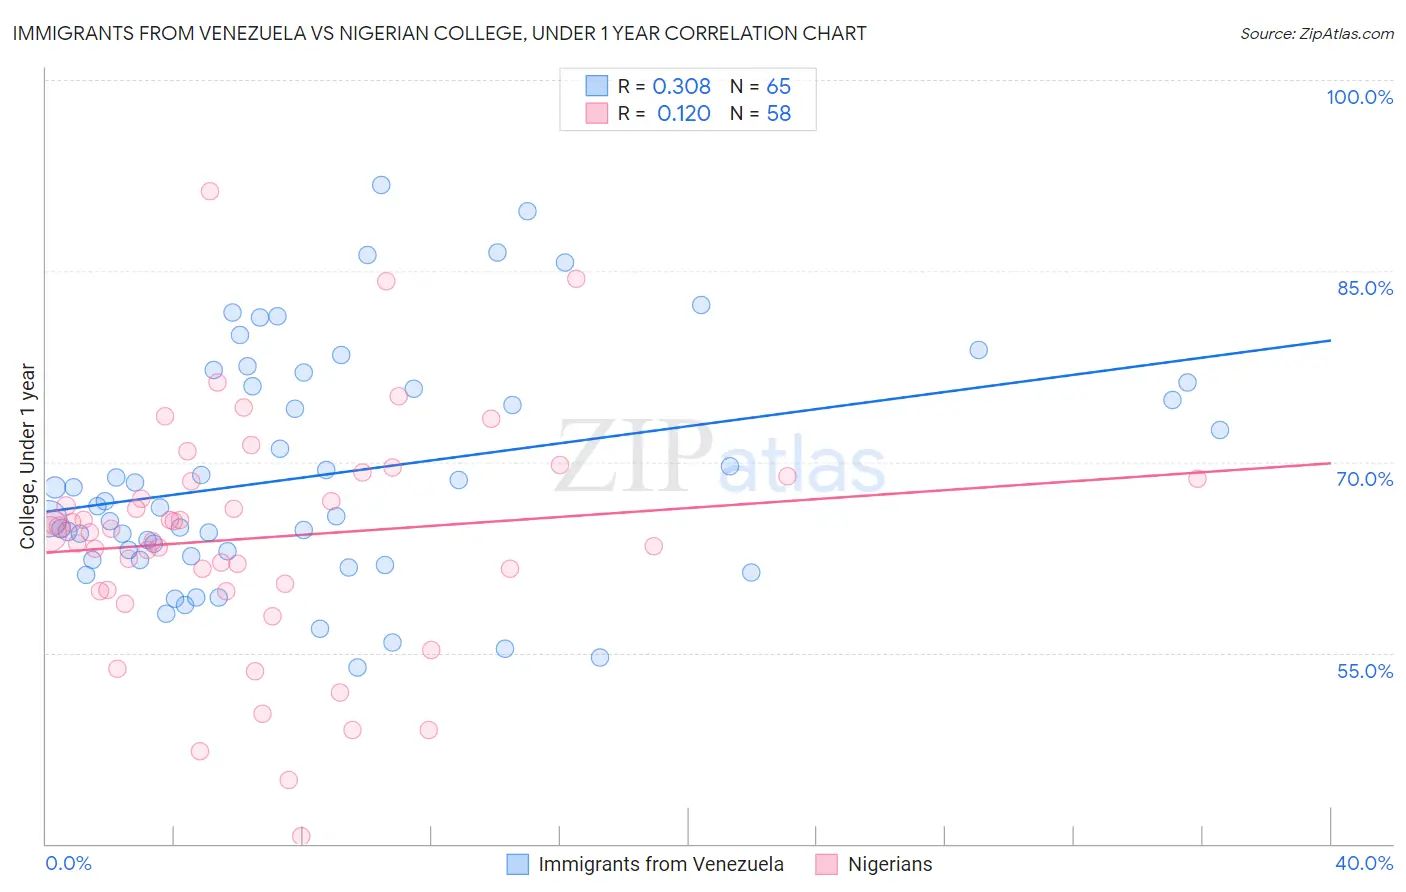
Immigrants from Venezuela vs Nigerian College, Under 1 year Correlation Chart
The statistical analysis conducted on geographies consisting of 287,866,009 people shows a mild positive correlation between the proportion of Immigrants from Venezuela and percentage of population with at least college, under 1 year education in the United States with a correlation coefficient (R) of 0.308 and weighted average of 66.3%. Similarly, the statistical analysis conducted on geographies consisting of 332,779,766 people shows a poor positive correlation between the proportion of Nigerians and percentage of population with at least college, under 1 year education in the United States with a correlation coefficient (R) of 0.120 and weighted average of 64.3%, a difference of 3.2%.
College, Under 1 year Correlation Summary
| Measurement | Immigrants from Venezuela | Nigerian |
| Minimum | 53.8% | 40.6% |
| Maximum | 91.7% | 91.3% |
| Range | 37.9% | 50.7% |
| Mean | 69.0% | 64.0% |
| Median | 66.5% | 64.6% |
| Interquartile 25% (IQ1) | 62.4% | 59.9% |
| Interquartile 75% (IQ3) | 76.1% | 68.7% |
| Interquartile Range (IQR) | 13.7% | 8.8% |
| Standard Deviation (Sample) | 9.2% | 9.2% |
| Standard Deviation (Population) | 9.1% | 9.2% |
Similar Demographics by College, Under 1 year
Demographics Similar to Immigrants from Venezuela by College, Under 1 year
In terms of college, under 1 year, the demographic groups most similar to Immigrants from Venezuela are Taiwanese (66.4%, a difference of 0.040%), Immigrants from Iraq (66.3%, a difference of 0.050%), Immigrants from Sudan (66.2%, a difference of 0.12%), Sudanese (66.2%, a difference of 0.23%), and Immigrants from Morocco (66.5%, a difference of 0.25%).
| Demographics | Rating | Rank | College, Under 1 year |
| English | 82.9 /100 | #142 | Excellent 66.6% |
| Immigrants | Uganda | 82.8 /100 | #143 | Excellent 66.5% |
| Immigrants | Germany | 82.0 /100 | #144 | Excellent 66.5% |
| Immigrants | Kenya | 81.8 /100 | #145 | Excellent 66.5% |
| Kenyans | 81.7 /100 | #146 | Excellent 66.5% |
| Immigrants | Morocco | 81.7 /100 | #147 | Excellent 66.5% |
| Taiwanese | 78.6 /100 | #148 | Good 66.4% |
| Immigrants | Venezuela | 77.9 /100 | #149 | Good 66.3% |
| Immigrants | Iraq | 77.1 /100 | #150 | Good 66.3% |
| Immigrants | Sudan | 76.0 /100 | #151 | Good 66.2% |
| Sudanese | 74.1 /100 | #152 | Good 66.2% |
| Belgians | 73.7 /100 | #153 | Good 66.2% |
| Immigrants | Eritrea | 71.9 /100 | #154 | Good 66.1% |
| Irish | 70.3 /100 | #155 | Good 66.0% |
| Welsh | 69.9 /100 | #156 | Good 66.0% |
Demographics Similar to Nigerians by College, Under 1 year
In terms of college, under 1 year, the demographic groups most similar to Nigerians are Panamanian (64.3%, a difference of 0.020%), French Canadian (64.2%, a difference of 0.040%), South American (64.2%, a difference of 0.040%), Tsimshian (64.3%, a difference of 0.090%), and Uruguayan (64.2%, a difference of 0.090%).
| Demographics | Rating | Rank | College, Under 1 year |
| Slovaks | 26.7 /100 | #193 | Fair 64.7% |
| Immigrants | Cameroon | 24.6 /100 | #194 | Fair 64.6% |
| Immigrants | South Eastern Asia | 22.1 /100 | #195 | Fair 64.5% |
| Tongans | 21.2 /100 | #196 | Fair 64.5% |
| Costa Ricans | 19.6 /100 | #197 | Poor 64.4% |
| Tsimshian | 17.9 /100 | #198 | Poor 64.3% |
| Panamanians | 17.0 /100 | #199 | Poor 64.3% |
| Nigerians | 16.7 /100 | #200 | Poor 64.3% |
| French Canadians | 16.3 /100 | #201 | Poor 64.2% |
| South Americans | 16.2 /100 | #202 | Poor 64.2% |
| Uruguayans | 15.6 /100 | #203 | Poor 64.2% |
| Immigrants | Zaire | 14.6 /100 | #204 | Poor 64.1% |
| Peruvians | 13.7 /100 | #205 | Poor 64.1% |
| Whites/Caucasians | 12.8 /100 | #206 | Poor 64.0% |
| Colombians | 12.4 /100 | #207 | Poor 64.0% |