Immigrants from Venezuela vs Immigrants from Guyana Professional Degree
COMPARE
Immigrants from Venezuela
Immigrants from Guyana
Professional Degree
Professional Degree Comparison
Immigrants from Venezuela
Immigrants from Guyana
4.8%
PROFESSIONAL DEGREE
93.8/ 100
METRIC RATING
123rd/ 347
METRIC RANK
3.7%
PROFESSIONAL DEGREE
1.0/ 100
METRIC RATING
261st/ 347
METRIC RANK
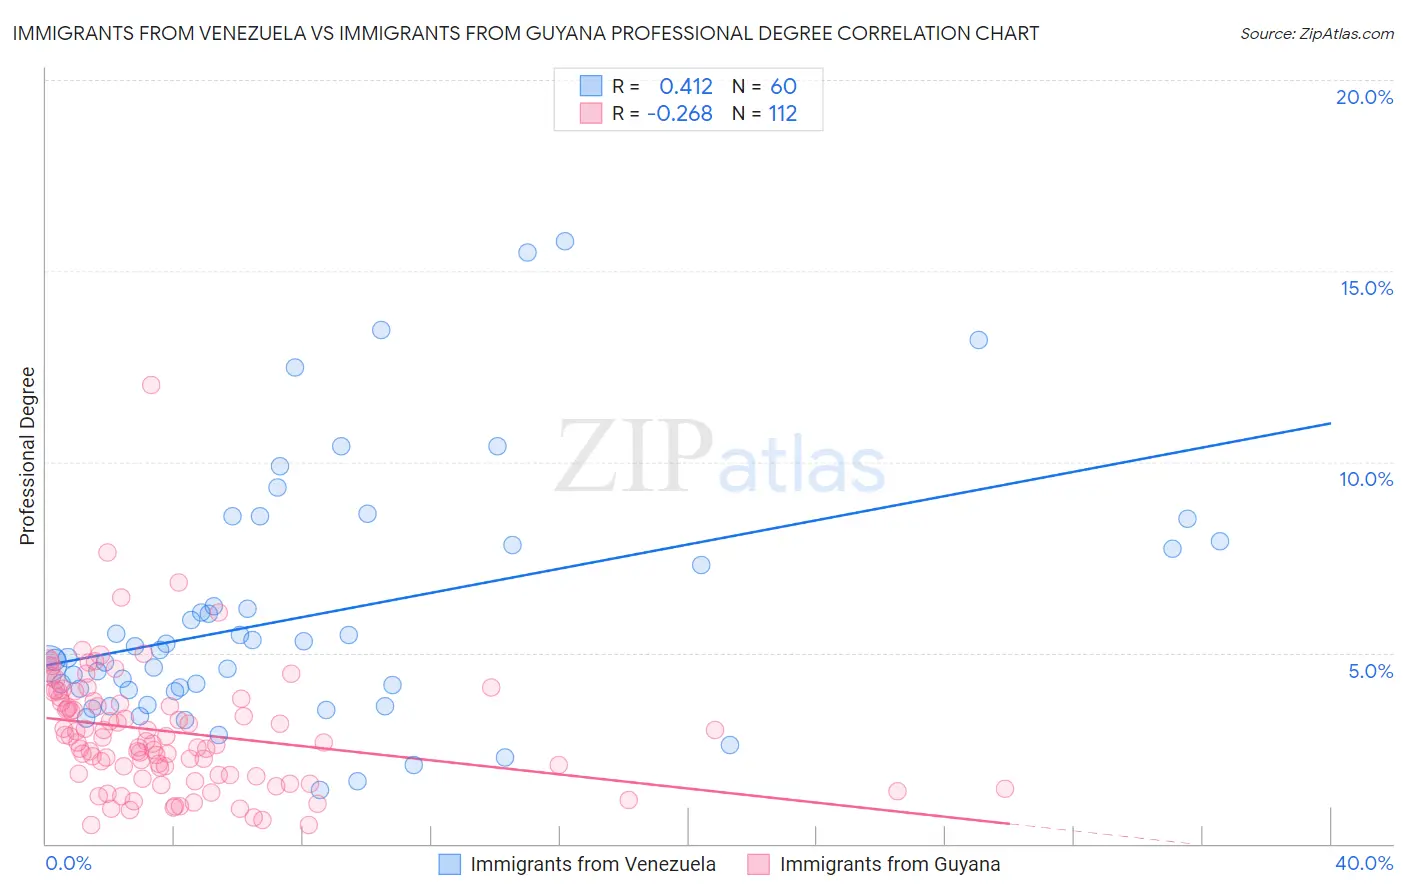
Immigrants from Venezuela vs Immigrants from Guyana Professional Degree Correlation Chart
The statistical analysis conducted on geographies consisting of 287,618,886 people shows a moderate positive correlation between the proportion of Immigrants from Venezuela and percentage of population with at least professional degree education in the United States with a correlation coefficient (R) of 0.412 and weighted average of 4.8%. Similarly, the statistical analysis conducted on geographies consisting of 183,575,789 people shows a weak negative correlation between the proportion of Immigrants from Guyana and percentage of population with at least professional degree education in the United States with a correlation coefficient (R) of -0.268 and weighted average of 3.7%, a difference of 32.1%.
Professional Degree Correlation Summary
| Measurement | Immigrants from Venezuela | Immigrants from Guyana |
| Minimum | 1.4% | 0.50% |
| Maximum | 15.8% | 12.0% |
| Range | 14.4% | 11.5% |
| Mean | 6.0% | 2.9% |
| Median | 5.0% | 2.7% |
| Interquartile 25% (IQ1) | 4.0% | 1.8% |
| Interquartile 75% (IQ3) | 7.8% | 3.8% |
| Interquartile Range (IQR) | 3.8% | 2.0% |
| Standard Deviation (Sample) | 3.3% | 1.6% |
| Standard Deviation (Population) | 3.2% | 1.6% |
Similar Demographics by Professional Degree
Demographics Similar to Immigrants from Venezuela by Professional Degree
In terms of professional degree, the demographic groups most similar to Immigrants from Venezuela are Immigrants from Germany (4.9%, a difference of 0.17%), Immigrants from Eritrea (4.8%, a difference of 0.18%), Immigrants from Albania (4.8%, a difference of 0.31%), European (4.8%, a difference of 0.36%), and Immigrants from Moldova (4.9%, a difference of 0.63%).
| Demographics | Rating | Rank | Professional Degree |
| Venezuelans | 96.3 /100 | #116 | Exceptional 4.9% |
| Immigrants | Syria | 96.0 /100 | #117 | Exceptional 4.9% |
| Croatians | 96.0 /100 | #118 | Exceptional 4.9% |
| Immigrants | Sudan | 95.4 /100 | #119 | Exceptional 4.9% |
| Albanians | 95.3 /100 | #120 | Exceptional 4.9% |
| Immigrants | Moldova | 94.8 /100 | #121 | Exceptional 4.9% |
| Immigrants | Germany | 94.1 /100 | #122 | Exceptional 4.9% |
| Immigrants | Venezuela | 93.8 /100 | #123 | Exceptional 4.8% |
| Immigrants | Eritrea | 93.5 /100 | #124 | Exceptional 4.8% |
| Immigrants | Albania | 93.3 /100 | #125 | Exceptional 4.8% |
| Europeans | 93.2 /100 | #126 | Exceptional 4.8% |
| Serbians | 92.6 /100 | #127 | Exceptional 4.8% |
| Immigrants | Eastern Africa | 92.5 /100 | #128 | Exceptional 4.8% |
| Palestinians | 91.5 /100 | #129 | Exceptional 4.8% |
| Icelanders | 91.5 /100 | #130 | Exceptional 4.8% |
Demographics Similar to Immigrants from Guyana by Professional Degree
In terms of professional degree, the demographic groups most similar to Immigrants from Guyana are U.S. Virgin Islander (3.7%, a difference of 0.010%), Indonesian (3.7%, a difference of 0.18%), African (3.7%, a difference of 0.19%), Immigrants from St. Vincent and the Grenadines (3.7%, a difference of 0.41%), and Bahamian (3.7%, a difference of 0.49%).
| Demographics | Rating | Rank | Professional Degree |
| Tongans | 1.3 /100 | #254 | Tragic 3.7% |
| Osage | 1.2 /100 | #255 | Tragic 3.7% |
| Iroquois | 1.2 /100 | #256 | Tragic 3.7% |
| Bahamians | 1.1 /100 | #257 | Tragic 3.7% |
| Immigrants | St. Vincent and the Grenadines | 1.1 /100 | #258 | Tragic 3.7% |
| Africans | 1.0 /100 | #259 | Tragic 3.7% |
| Indonesians | 1.0 /100 | #260 | Tragic 3.7% |
| Immigrants | Guyana | 1.0 /100 | #261 | Tragic 3.7% |
| U.S. Virgin Islanders | 1.0 /100 | #262 | Tragic 3.7% |
| Hopi | 0.9 /100 | #263 | Tragic 3.6% |
| Immigrants | Cambodia | 0.9 /100 | #264 | Tragic 3.6% |
| Immigrants | Congo | 0.8 /100 | #265 | Tragic 3.6% |
| Central American Indians | 0.8 /100 | #266 | Tragic 3.6% |
| Delaware | 0.7 /100 | #267 | Tragic 3.6% |
| Aleuts | 0.7 /100 | #268 | Tragic 3.6% |