Immigrants from Venezuela vs Immigrants from Cameroon College, 1 year or more
COMPARE
Immigrants from Venezuela
Immigrants from Cameroon
College, 1 year or more
College, 1 year or more Comparison
Immigrants from Venezuela
Immigrants from Cameroon
61.0%
COLLEGE, 1 YEAR OR MORE
87.9/ 100
METRIC RATING
134th/ 347
METRIC RANK
58.8%
COLLEGE, 1 YEAR OR MORE
31.2/ 100
METRIC RATING
190th/ 347
METRIC RANK
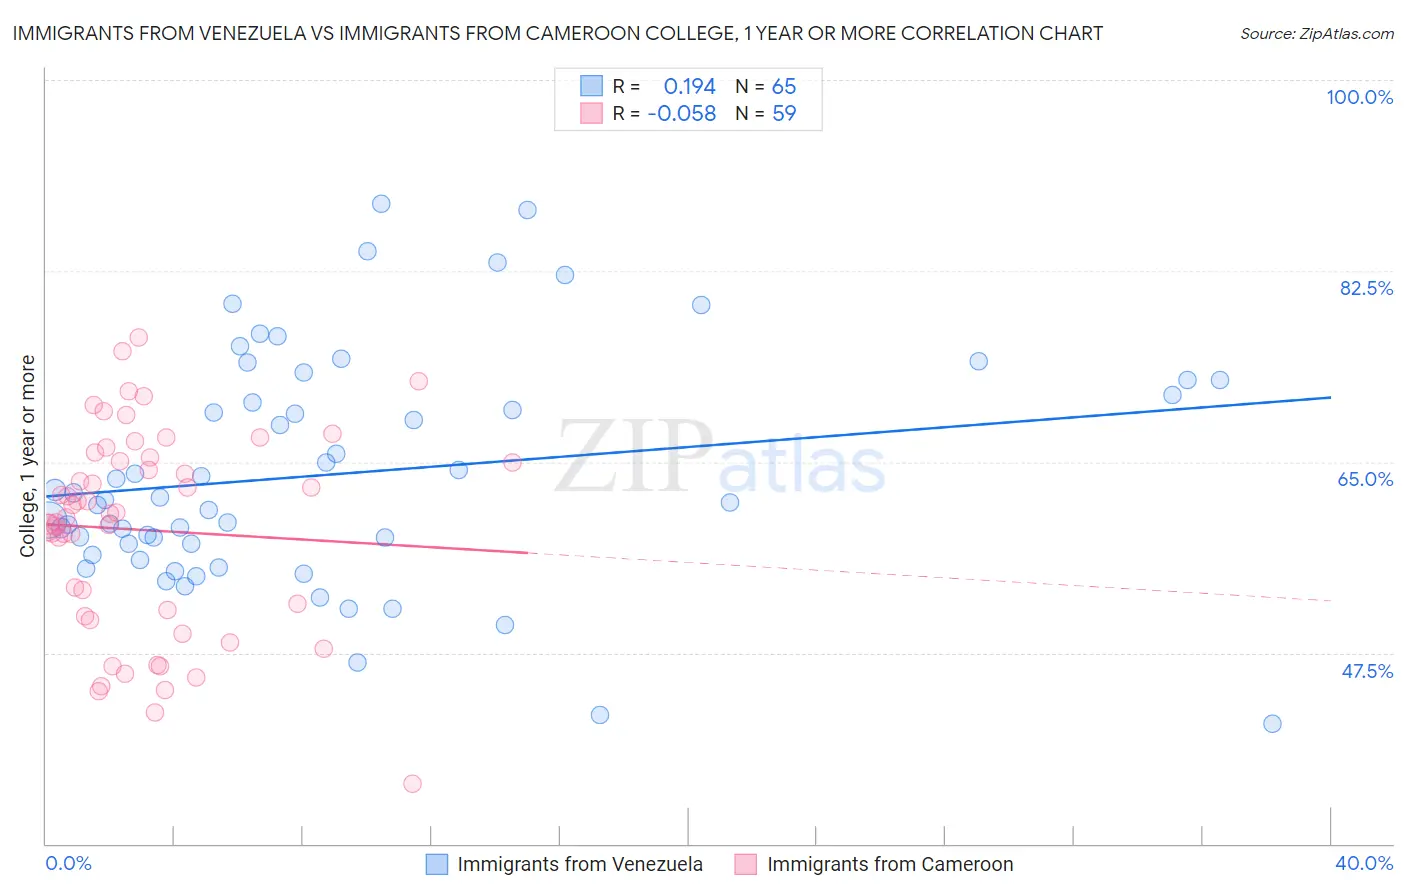
Immigrants from Venezuela vs Immigrants from Cameroon College, 1 year or more Correlation Chart
The statistical analysis conducted on geographies consisting of 287,865,065 people shows a poor positive correlation between the proportion of Immigrants from Venezuela and percentage of population with at least college, 1 year or more education in the United States with a correlation coefficient (R) of 0.194 and weighted average of 61.0%. Similarly, the statistical analysis conducted on geographies consisting of 130,767,721 people shows a slight negative correlation between the proportion of Immigrants from Cameroon and percentage of population with at least college, 1 year or more education in the United States with a correlation coefficient (R) of -0.058 and weighted average of 58.8%, a difference of 3.7%.
College, 1 year or more Correlation Summary
| Measurement | Immigrants from Venezuela | Immigrants from Cameroon |
| Minimum | 41.0% | 35.5% |
| Maximum | 88.6% | 76.4% |
| Range | 47.7% | 40.9% |
| Mean | 63.9% | 58.7% |
| Median | 61.5% | 60.2% |
| Interquartile 25% (IQ1) | 57.0% | 50.9% |
| Interquartile 75% (IQ3) | 71.8% | 65.4% |
| Interquartile Range (IQR) | 14.8% | 14.5% |
| Standard Deviation (Sample) | 10.6% | 9.3% |
| Standard Deviation (Population) | 10.5% | 9.2% |
Similar Demographics by College, 1 year or more
Demographics Similar to Immigrants from Venezuela by College, 1 year or more
In terms of college, 1 year or more, the demographic groups most similar to Immigrants from Venezuela are Immigrants from Uzbekistan (61.0%, a difference of 0.010%), Scandinavian (61.0%, a difference of 0.040%), Immigrants from Uganda (60.9%, a difference of 0.060%), Basque (60.9%, a difference of 0.080%), and Slovene (60.9%, a difference of 0.16%).
| Demographics | Rating | Rank | College, 1 year or more |
| Immigrants | Eastern Africa | 91.1 /100 | #127 | Exceptional 61.2% |
| Immigrants | Italy | 91.1 /100 | #128 | Exceptional 61.2% |
| Ugandans | 90.7 /100 | #129 | Exceptional 61.2% |
| Italians | 89.5 /100 | #130 | Excellent 61.1% |
| Immigrants | Morocco | 89.5 /100 | #131 | Excellent 61.1% |
| Scandinavians | 88.2 /100 | #132 | Excellent 61.0% |
| Immigrants | Uzbekistan | 88.0 /100 | #133 | Excellent 61.0% |
| Immigrants | Venezuela | 87.9 /100 | #134 | Excellent 61.0% |
| Immigrants | Uganda | 87.4 /100 | #135 | Excellent 60.9% |
| Basques | 87.2 /100 | #136 | Excellent 60.9% |
| Slovenes | 86.5 /100 | #137 | Excellent 60.9% |
| Taiwanese | 84.3 /100 | #138 | Excellent 60.7% |
| Immigrants | Eritrea | 84.3 /100 | #139 | Excellent 60.7% |
| Iraqis | 83.3 /100 | #140 | Excellent 60.7% |
| Immigrants | Afghanistan | 83.1 /100 | #141 | Excellent 60.7% |
Demographics Similar to Immigrants from Cameroon by College, 1 year or more
In terms of college, 1 year or more, the demographic groups most similar to Immigrants from Cameroon are Uruguayan (58.8%, a difference of 0.040%), Immigrants from Philippines (58.7%, a difference of 0.13%), French (58.9%, a difference of 0.19%), Scotch-Irish (58.9%, a difference of 0.21%), and German (58.9%, a difference of 0.21%).
| Demographics | Rating | Rank | College, 1 year or more |
| German Russians | 39.3 /100 | #183 | Fair 59.1% |
| Spaniards | 38.3 /100 | #184 | Fair 59.0% |
| South Americans | 35.9 /100 | #185 | Fair 59.0% |
| Scotch-Irish | 34.7 /100 | #186 | Fair 58.9% |
| Germans | 34.7 /100 | #187 | Fair 58.9% |
| French | 34.4 /100 | #188 | Fair 58.9% |
| Uruguayans | 31.8 /100 | #189 | Fair 58.8% |
| Immigrants | Cameroon | 31.2 /100 | #190 | Fair 58.8% |
| Immigrants | Philippines | 29.2 /100 | #191 | Fair 58.7% |
| Colombians | 27.6 /100 | #192 | Fair 58.7% |
| Peruvians | 27.5 /100 | #193 | Fair 58.6% |
| Costa Ricans | 26.4 /100 | #194 | Fair 58.6% |
| Dutch | 26.2 /100 | #195 | Fair 58.6% |
| Guamanians/Chamorros | 26.2 /100 | #196 | Fair 58.6% |
| Immigrants | Thailand | 26.0 /100 | #197 | Fair 58.6% |