Immigrants from Uzbekistan vs Honduran Births to Unmarried Women
COMPARE
Immigrants from Uzbekistan
Honduran
Births to Unmarried Women
Births to Unmarried Women Comparison
Immigrants from Uzbekistan
Hondurans
25.8%
BIRTHS TO UNMARRIED WOMEN
100.0/ 100
METRIC RATING
17th/ 347
METRIC RANK
38.7%
BIRTHS TO UNMARRIED WOMEN
0.0/ 100
METRIC RATING
302nd/ 347
METRIC RANK
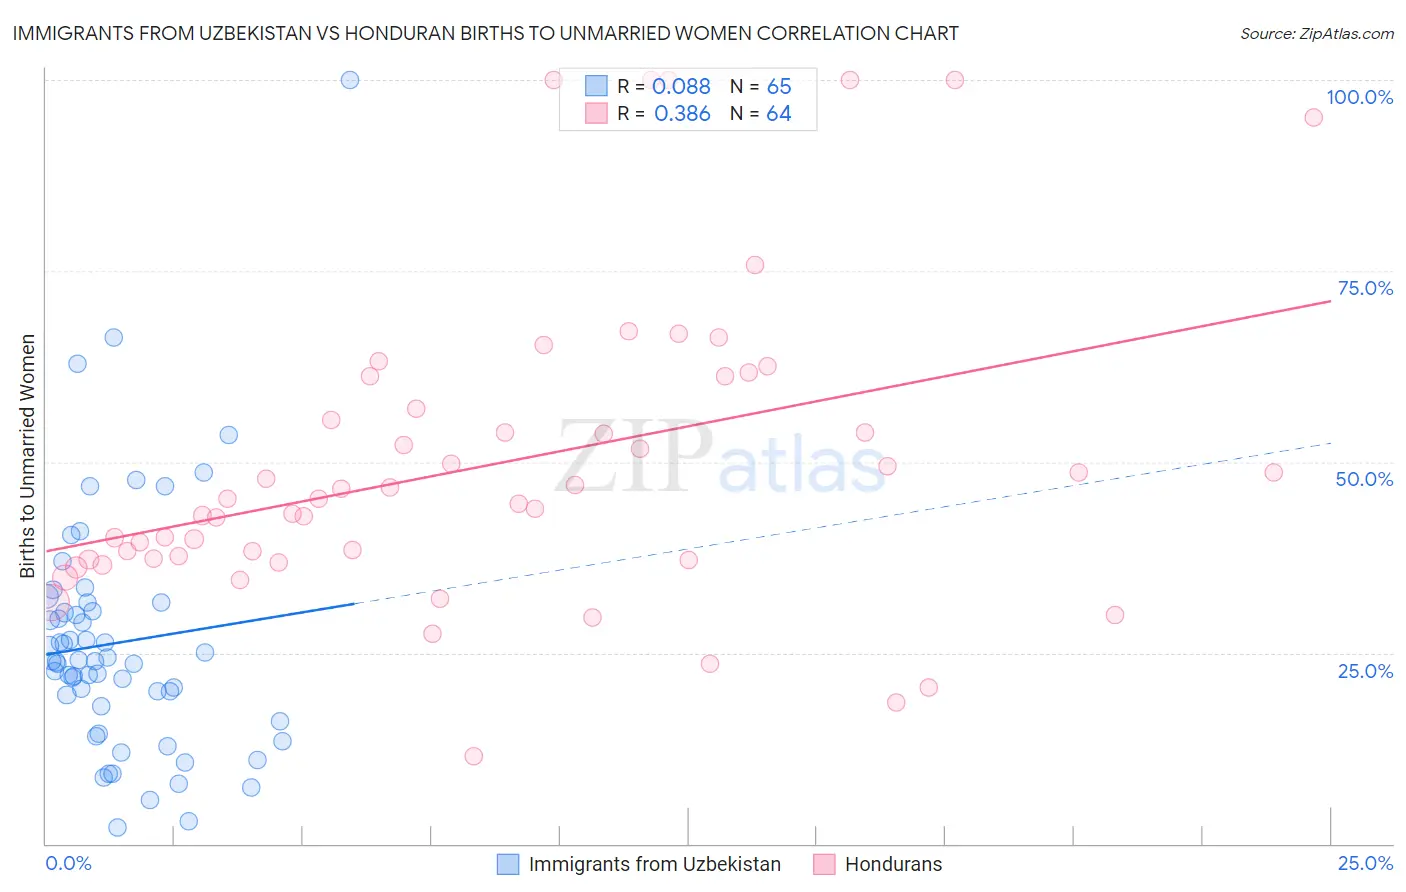
Immigrants from Uzbekistan vs Honduran Births to Unmarried Women Correlation Chart
The statistical analysis conducted on geographies consisting of 114,110,355 people shows a slight positive correlation between the proportion of Immigrants from Uzbekistan and percentage of births to unmarried women in the United States with a correlation coefficient (R) of 0.088 and weighted average of 25.8%. Similarly, the statistical analysis conducted on geographies consisting of 342,571,212 people shows a mild positive correlation between the proportion of Hondurans and percentage of births to unmarried women in the United States with a correlation coefficient (R) of 0.386 and weighted average of 38.7%, a difference of 50.0%.
Births to Unmarried Women Correlation Summary
| Measurement | Immigrants from Uzbekistan | Honduran |
| Minimum | 2.0% | 11.5% |
| Maximum | 100.0% | 100.0% |
| Range | 98.0% | 88.5% |
| Mean | 26.3% | 49.8% |
| Median | 23.9% | 45.2% |
| Interquartile 25% (IQ1) | 17.0% | 37.3% |
| Interquartile 75% (IQ3) | 31.0% | 59.0% |
| Interquartile Range (IQR) | 14.0% | 21.8% |
| Standard Deviation (Sample) | 16.2% | 20.3% |
| Standard Deviation (Population) | 16.0% | 20.1% |
Similar Demographics by Births to Unmarried Women
Demographics Similar to Immigrants from Uzbekistan by Births to Unmarried Women
In terms of births to unmarried women, the demographic groups most similar to Immigrants from Uzbekistan are Immigrants from Belarus (25.6%, a difference of 0.57%), Immigrants from Singapore (25.6%, a difference of 0.62%), Immigrants from Armenia (26.1%, a difference of 1.1%), Armenian (26.2%, a difference of 1.7%), and Immigrants from Lebanon (25.3%, a difference of 1.8%).
| Demographics | Rating | Rank | Births to Unmarried Women |
| Immigrants | Eastern Asia | 100.0 /100 | #10 | Exceptional 25.0% |
| Immigrants | Israel | 100.0 /100 | #11 | Exceptional 25.1% |
| Indians (Asian) | 100.0 /100 | #12 | Exceptional 25.3% |
| Iranians | 100.0 /100 | #13 | Exceptional 25.3% |
| Immigrants | Lebanon | 100.0 /100 | #14 | Exceptional 25.3% |
| Immigrants | Singapore | 100.0 /100 | #15 | Exceptional 25.6% |
| Immigrants | Belarus | 100.0 /100 | #16 | Exceptional 25.6% |
| Immigrants | Uzbekistan | 100.0 /100 | #17 | Exceptional 25.8% |
| Immigrants | Armenia | 99.9 /100 | #18 | Exceptional 26.1% |
| Armenians | 99.9 /100 | #19 | Exceptional 26.2% |
| Immigrants | Korea | 99.9 /100 | #20 | Exceptional 26.3% |
| Soviet Union | 99.9 /100 | #21 | Exceptional 26.3% |
| Burmese | 99.9 /100 | #22 | Exceptional 26.4% |
| Immigrants | Japan | 99.9 /100 | #23 | Exceptional 26.4% |
| Immigrants | Australia | 99.9 /100 | #24 | Exceptional 26.6% |
Demographics Similar to Hondurans by Births to Unmarried Women
In terms of births to unmarried women, the demographic groups most similar to Hondurans are Haitian (38.6%, a difference of 0.24%), Immigrants from West Indies (38.6%, a difference of 0.25%), Spanish American (38.6%, a difference of 0.31%), Immigrants from Jamaica (38.8%, a difference of 0.32%), and Yaqui (38.8%, a difference of 0.37%).
| Demographics | Rating | Rank | Births to Unmarried Women |
| Iroquois | 0.0 /100 | #295 | Tragic 38.2% |
| Alaska Natives | 0.0 /100 | #296 | Tragic 38.3% |
| Dutch West Indians | 0.0 /100 | #297 | Tragic 38.4% |
| Jamaicans | 0.0 /100 | #298 | Tragic 38.5% |
| Spanish Americans | 0.0 /100 | #299 | Tragic 38.6% |
| Immigrants | West Indies | 0.0 /100 | #300 | Tragic 38.6% |
| Haitians | 0.0 /100 | #301 | Tragic 38.6% |
| Hondurans | 0.0 /100 | #302 | Tragic 38.7% |
| Immigrants | Jamaica | 0.0 /100 | #303 | Tragic 38.8% |
| Yaqui | 0.0 /100 | #304 | Tragic 38.8% |
| Immigrants | Haiti | 0.0 /100 | #305 | Tragic 38.9% |
| Central American Indians | 0.0 /100 | #306 | Tragic 39.0% |
| Immigrants | Honduras | 0.0 /100 | #307 | Tragic 39.3% |
| Aleuts | 0.0 /100 | #308 | Tragic 39.3% |
| Cubans | 0.0 /100 | #309 | Tragic 39.4% |