American vs Honduran College, Under 1 year
COMPARE
American
Honduran
College, Under 1 year
College, Under 1 year Comparison
Americans
Hondurans
61.0%
COLLEGE, UNDER 1 YEAR
0.2/ 100
METRIC RATING
267th/ 347
METRIC RANK
57.1%
COLLEGE, UNDER 1 YEAR
0.0/ 100
METRIC RATING
315th/ 347
METRIC RANK
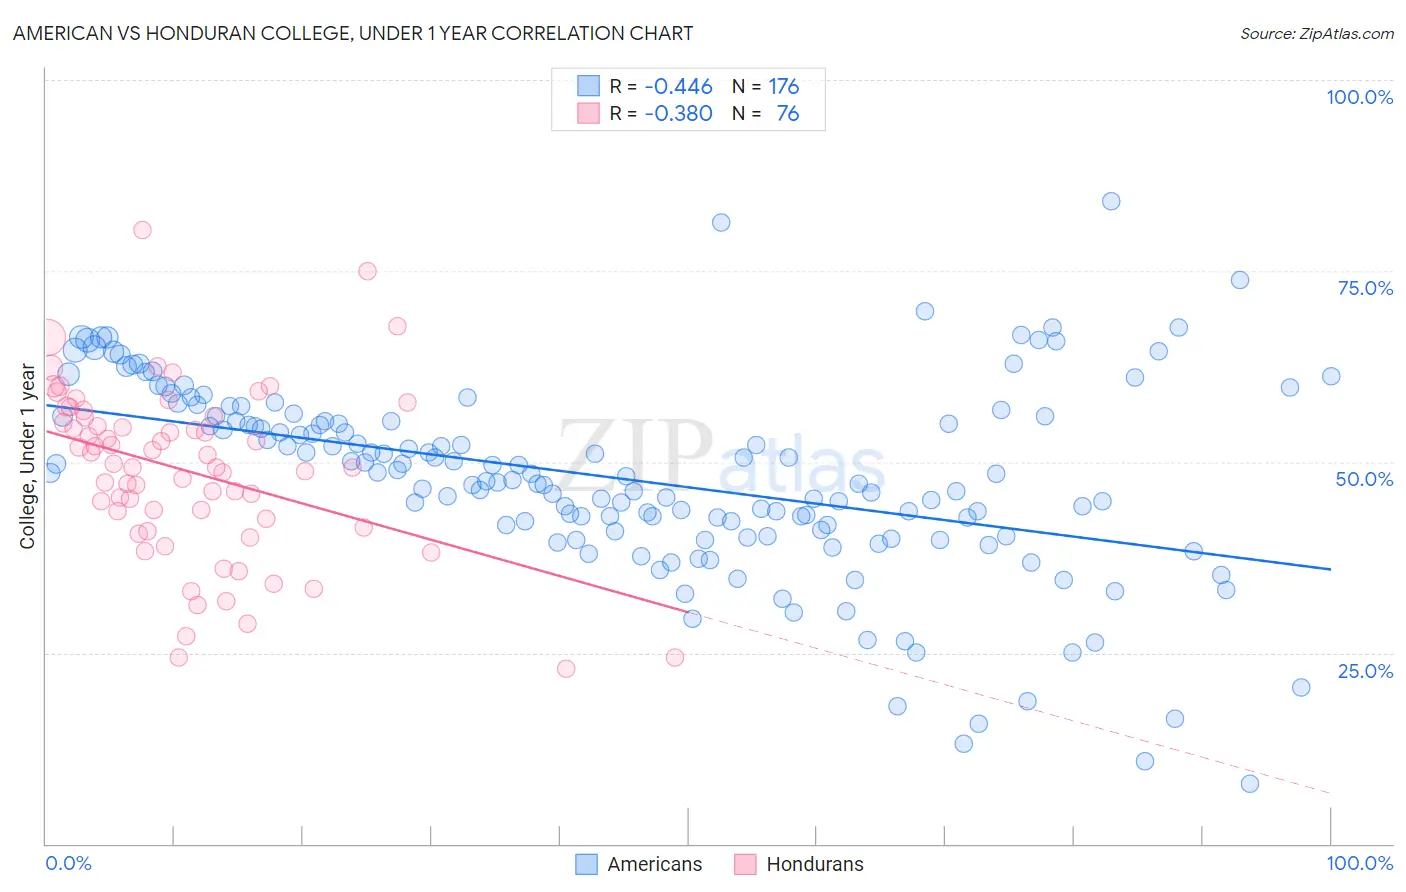
American vs Honduran College, Under 1 year Correlation Chart
The statistical analysis conducted on geographies consisting of 581,978,241 people shows a moderate negative correlation between the proportion of Americans and percentage of population with at least college, under 1 year education in the United States with a correlation coefficient (R) of -0.446 and weighted average of 61.0%. Similarly, the statistical analysis conducted on geographies consisting of 357,856,249 people shows a mild negative correlation between the proportion of Hondurans and percentage of population with at least college, under 1 year education in the United States with a correlation coefficient (R) of -0.380 and weighted average of 57.1%, a difference of 6.9%.
College, Under 1 year Correlation Summary
| Measurement | American | Honduran |
| Minimum | 7.8% | 22.9% |
| Maximum | 84.1% | 80.4% |
| Range | 76.3% | 57.4% |
| Mean | 47.8% | 48.8% |
| Median | 48.2% | 49.5% |
| Interquartile 25% (IQ1) | 41.1% | 41.9% |
| Interquartile 75% (IQ3) | 55.9% | 55.9% |
| Interquartile Range (IQR) | 14.9% | 14.0% |
| Standard Deviation (Sample) | 12.8% | 11.3% |
| Standard Deviation (Population) | 12.8% | 11.2% |
Similar Demographics by College, Under 1 year
Demographics Similar to Americans by College, Under 1 year
In terms of college, under 1 year, the demographic groups most similar to Americans are Alaskan Athabascan (61.0%, a difference of 0.010%), Trinidadian and Tobagonian (61.1%, a difference of 0.13%), Immigrants from Bahamas (61.1%, a difference of 0.13%), Shoshone (61.1%, a difference of 0.19%), and Barbadian (61.1%, a difference of 0.20%).
| Demographics | Rating | Rank | College, Under 1 year |
| Blackfeet | 0.3 /100 | #260 | Tragic 61.1% |
| Africans | 0.3 /100 | #261 | Tragic 61.1% |
| Barbadians | 0.2 /100 | #262 | Tragic 61.1% |
| Shoshone | 0.2 /100 | #263 | Tragic 61.1% |
| Trinidadians and Tobagonians | 0.2 /100 | #264 | Tragic 61.1% |
| Immigrants | Bahamas | 0.2 /100 | #265 | Tragic 61.1% |
| Alaskan Athabascans | 0.2 /100 | #266 | Tragic 61.0% |
| Americans | 0.2 /100 | #267 | Tragic 61.0% |
| Immigrants | Trinidad and Tobago | 0.1 /100 | #268 | Tragic 60.7% |
| Immigrants | West Indies | 0.1 /100 | #269 | Tragic 60.6% |
| Cheyenne | 0.1 /100 | #270 | Tragic 60.6% |
| U.S. Virgin Islanders | 0.1 /100 | #271 | Tragic 60.6% |
| Jamaicans | 0.1 /100 | #272 | Tragic 60.5% |
| Chickasaw | 0.1 /100 | #273 | Tragic 60.4% |
| Alaska Natives | 0.1 /100 | #274 | Tragic 60.4% |
Demographics Similar to Hondurans by College, Under 1 year
In terms of college, under 1 year, the demographic groups most similar to Hondurans are Hopi (57.1%, a difference of 0.040%), Menominee (57.0%, a difference of 0.050%), Hispanic or Latino (57.0%, a difference of 0.090%), Dutch West Indian (57.2%, a difference of 0.16%), and Immigrants from Haiti (56.9%, a difference of 0.21%).
| Demographics | Rating | Rank | College, Under 1 year |
| Central Americans | 0.0 /100 | #308 | Tragic 57.7% |
| Immigrants | Nicaragua | 0.0 /100 | #309 | Tragic 57.6% |
| Pueblo | 0.0 /100 | #310 | Tragic 57.4% |
| Cajuns | 0.0 /100 | #311 | Tragic 57.3% |
| Salvadorans | 0.0 /100 | #312 | Tragic 57.3% |
| Dutch West Indians | 0.0 /100 | #313 | Tragic 57.2% |
| Hopi | 0.0 /100 | #314 | Tragic 57.1% |
| Hondurans | 0.0 /100 | #315 | Tragic 57.1% |
| Menominee | 0.0 /100 | #316 | Tragic 57.0% |
| Hispanics or Latinos | 0.0 /100 | #317 | Tragic 57.0% |
| Immigrants | Haiti | 0.0 /100 | #318 | Tragic 56.9% |
| Puerto Ricans | 0.0 /100 | #319 | Tragic 56.8% |
| Guatemalans | 0.0 /100 | #320 | Tragic 56.8% |
| Natives/Alaskans | 0.0 /100 | #321 | Tragic 56.6% |
| Immigrants | Caribbean | 0.0 /100 | #322 | Tragic 56.6% |