Immigrants from Uganda vs Chilean GED/Equivalency
COMPARE
Immigrants from Uganda
Chilean
GED/Equivalency
GED/Equivalency Comparison
Immigrants from Uganda
Chileans
85.7%
GED/EQUIVALENCY
45.2/ 100
METRIC RATING
177th/ 347
METRIC RANK
86.6%
GED/EQUIVALENCY
86.9/ 100
METRIC RATING
136th/ 347
METRIC RANK
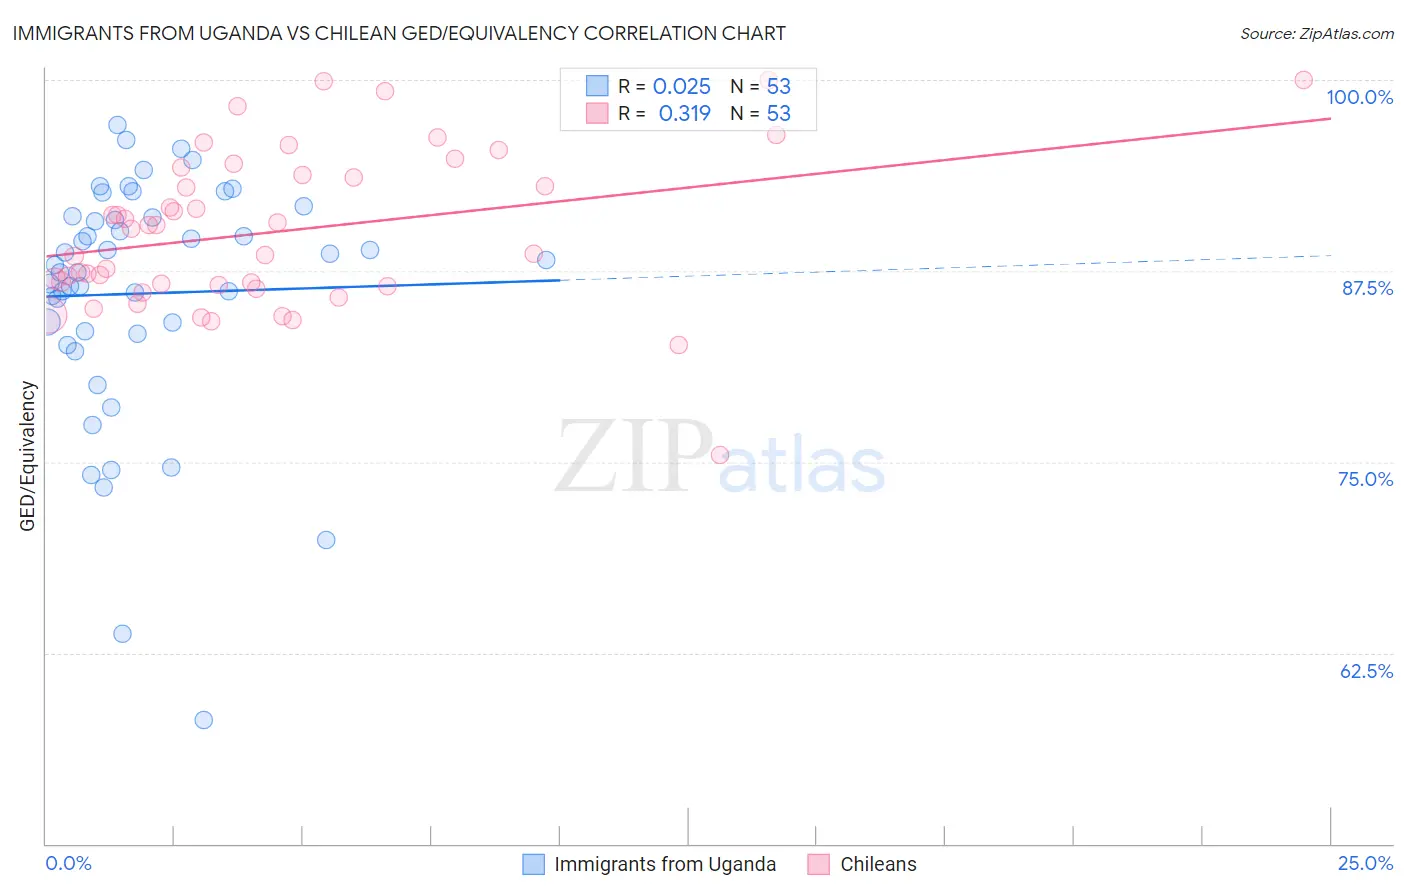
Immigrants from Uganda vs Chilean GED/Equivalency Correlation Chart
The statistical analysis conducted on geographies consisting of 125,982,219 people shows no correlation between the proportion of Immigrants from Uganda and percentage of population with at least ged/equivalency education in the United States with a correlation coefficient (R) of 0.025 and weighted average of 85.7%. Similarly, the statistical analysis conducted on geographies consisting of 256,681,007 people shows a mild positive correlation between the proportion of Chileans and percentage of population with at least ged/equivalency education in the United States with a correlation coefficient (R) of 0.319 and weighted average of 86.6%, a difference of 1.1%.
GED/Equivalency Correlation Summary
| Measurement | Immigrants from Uganda | Chilean |
| Minimum | 58.1% | 75.4% |
| Maximum | 97.1% | 100.0% |
| Range | 39.0% | 24.6% |
| Mean | 86.0% | 90.1% |
| Median | 87.9% | 90.3% |
| Interquartile 25% (IQ1) | 83.5% | 86.5% |
| Interquartile 75% (IQ3) | 91.1% | 94.0% |
| Interquartile Range (IQR) | 7.6% | 7.5% |
| Standard Deviation (Sample) | 8.0% | 5.1% |
| Standard Deviation (Population) | 7.9% | 5.1% |
Similar Demographics by GED/Equivalency
Demographics Similar to Immigrants from Uganda by GED/Equivalency
In terms of ged/equivalency, the demographic groups most similar to Immigrants from Uganda are Immigrants from Eastern Africa (85.7%, a difference of 0.050%), Korean (85.6%, a difference of 0.080%), Ottawa (85.8%, a difference of 0.10%), Immigrants from Bolivia (85.8%, a difference of 0.10%), and Aleut (85.6%, a difference of 0.10%).
| Demographics | Rating | Rank | GED/Equivalency |
| Afghans | 59.7 /100 | #170 | Average 85.9% |
| Immigrants | Chile | 57.3 /100 | #171 | Average 85.9% |
| Bermudans | 55.1 /100 | #172 | Average 85.8% |
| Immigrants | Venezuela | 50.7 /100 | #173 | Average 85.8% |
| Ottawa | 50.0 /100 | #174 | Average 85.8% |
| Immigrants | Bolivia | 49.8 /100 | #175 | Average 85.8% |
| Immigrants | Eastern Africa | 47.7 /100 | #176 | Average 85.7% |
| Immigrants | Uganda | 45.2 /100 | #177 | Average 85.7% |
| Koreans | 41.2 /100 | #178 | Average 85.6% |
| Aleuts | 40.5 /100 | #179 | Average 85.6% |
| Immigrants | Southern Europe | 38.4 /100 | #180 | Fair 85.5% |
| Moroccans | 37.7 /100 | #181 | Fair 85.5% |
| Sudanese | 35.2 /100 | #182 | Fair 85.5% |
| Immigrants | Sudan | 34.2 /100 | #183 | Fair 85.5% |
| Immigrants | Oceania | 33.6 /100 | #184 | Fair 85.5% |
Demographics Similar to Chileans by GED/Equivalency
In terms of ged/equivalency, the demographic groups most similar to Chileans are Arab (86.6%, a difference of 0.010%), Immigrants from Asia (86.6%, a difference of 0.020%), Immigrants from Argentina (86.6%, a difference of 0.020%), Albanian (86.6%, a difference of 0.040%), and Immigrants from Spain (86.7%, a difference of 0.070%).
| Demographics | Rating | Rank | GED/Equivalency |
| Immigrants | Ukraine | 88.9 /100 | #129 | Excellent 86.7% |
| Immigrants | Germany | 88.8 /100 | #130 | Excellent 86.7% |
| Immigrants | Spain | 88.5 /100 | #131 | Excellent 86.7% |
| Immigrants | Brazil | 88.4 /100 | #132 | Excellent 86.6% |
| Tsimshian | 88.3 /100 | #133 | Excellent 86.6% |
| Albanians | 87.7 /100 | #134 | Excellent 86.6% |
| Immigrants | Asia | 87.4 /100 | #135 | Excellent 86.6% |
| Chileans | 86.9 /100 | #136 | Excellent 86.6% |
| Arabs | 86.7 /100 | #137 | Excellent 86.6% |
| Immigrants | Argentina | 86.5 /100 | #138 | Excellent 86.6% |
| Immigrants | Malaysia | 85.0 /100 | #139 | Excellent 86.5% |
| Paraguayans | 84.1 /100 | #140 | Excellent 86.5% |
| Laotians | 83.2 /100 | #141 | Excellent 86.5% |
| Immigrants | Indonesia | 82.4 /100 | #142 | Excellent 86.4% |
| Immigrants | Pakistan | 82.4 /100 | #143 | Excellent 86.4% |