Immigrants from Turkey vs Mongolian College, Under 1 year
COMPARE
Immigrants from Turkey
Mongolian
College, Under 1 year
College, Under 1 year Comparison
Immigrants from Turkey
Mongolians
70.3%
COLLEGE, UNDER 1 YEAR
99.9/ 100
METRIC RATING
40th/ 347
METRIC RANK
69.9%
COLLEGE, UNDER 1 YEAR
99.8/ 100
METRIC RATING
51st/ 347
METRIC RANK
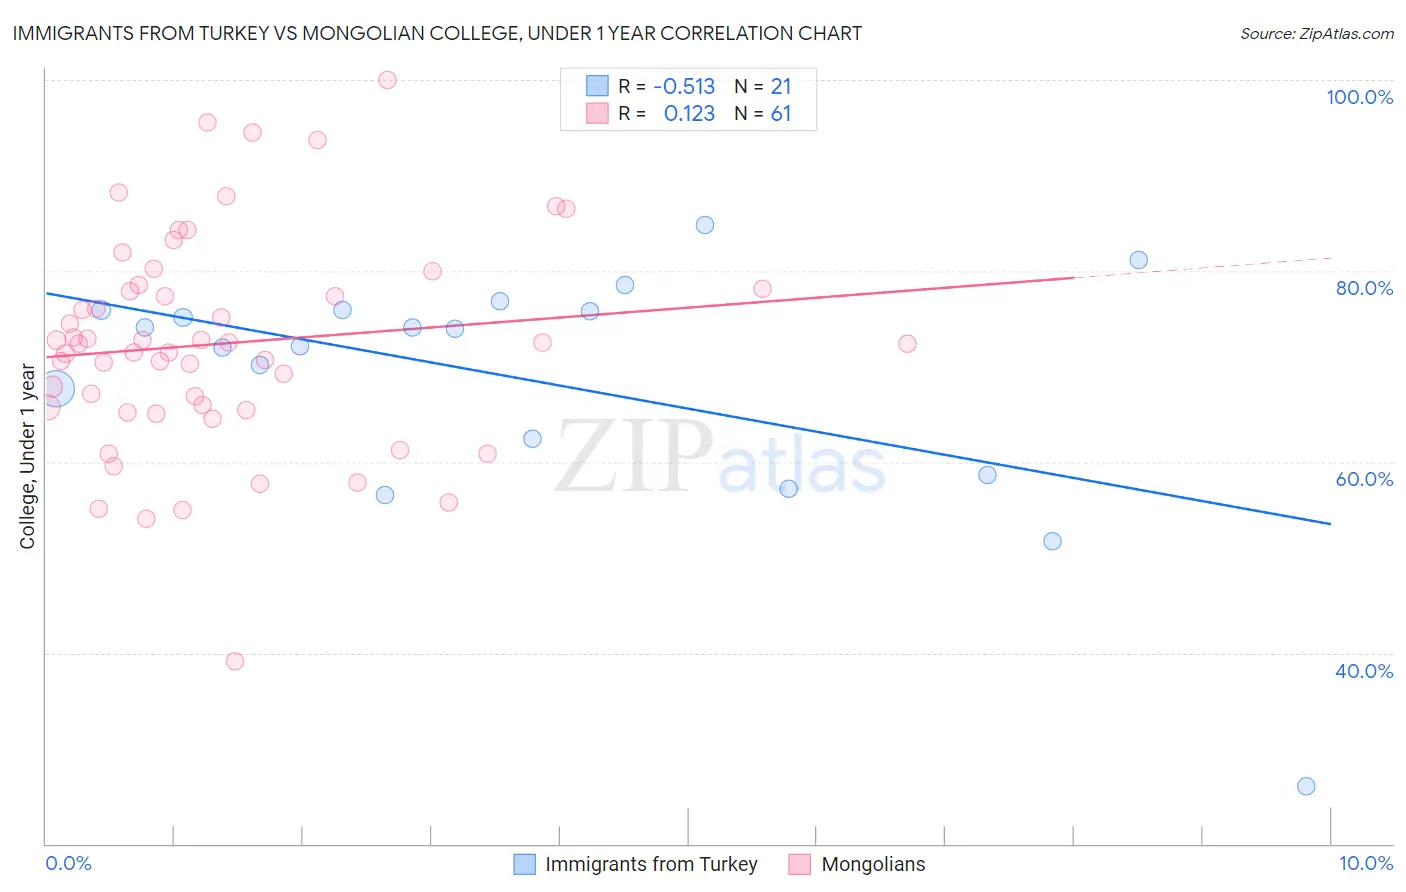
Immigrants from Turkey vs Mongolian College, Under 1 year Correlation Chart
The statistical analysis conducted on geographies consisting of 223,057,840 people shows a substantial negative correlation between the proportion of Immigrants from Turkey and percentage of population with at least college, under 1 year education in the United States with a correlation coefficient (R) of -0.513 and weighted average of 70.3%. Similarly, the statistical analysis conducted on geographies consisting of 140,362,004 people shows a poor positive correlation between the proportion of Mongolians and percentage of population with at least college, under 1 year education in the United States with a correlation coefficient (R) of 0.123 and weighted average of 69.9%, a difference of 0.66%.
College, Under 1 year Correlation Summary
| Measurement | Immigrants from Turkey | Mongolian |
| Minimum | 26.0% | 39.1% |
| Maximum | 84.8% | 100.0% |
| Range | 58.8% | 60.9% |
| Mean | 68.6% | 72.4% |
| Median | 74.0% | 72.4% |
| Interquartile 25% (IQ1) | 60.6% | 65.5% |
| Interquartile 75% (IQ3) | 75.9% | 78.3% |
| Interquartile Range (IQR) | 15.3% | 12.8% |
| Standard Deviation (Sample) | 13.1% | 11.3% |
| Standard Deviation (Population) | 12.8% | 11.2% |
Demographics Similar to Immigrants from Turkey and Mongolians by College, Under 1 year
In terms of college, under 1 year, the demographic groups most similar to Immigrants from Turkey are Bhutanese (70.3%, a difference of 0.010%), Australian (70.4%, a difference of 0.030%), Immigrants from Kuwait (70.3%, a difference of 0.040%), Immigrants from Lithuania (70.3%, a difference of 0.090%), and Immigrants from Saudi Arabia (70.4%, a difference of 0.10%). Similarly, the demographic groups most similar to Mongolians are Immigrants from Russia (69.9%, a difference of 0.020%), Zimbabwean (69.9%, a difference of 0.040%), Immigrants from Austria (70.0%, a difference of 0.15%), Immigrants from Netherlands (70.0%, a difference of 0.20%), and Immigrants from Bulgaria (70.0%, a difference of 0.25%).
| Demographics | Rating | Rank | College, Under 1 year |
| Russians | 99.9 /100 | #35 | Exceptional 70.5% |
| Immigrants | Sri Lanka | 99.9 /100 | #36 | Exceptional 70.5% |
| Immigrants | Saudi Arabia | 99.9 /100 | #37 | Exceptional 70.4% |
| Australians | 99.9 /100 | #38 | Exceptional 70.4% |
| Bhutanese | 99.9 /100 | #39 | Exceptional 70.3% |
| Immigrants | Turkey | 99.9 /100 | #40 | Exceptional 70.3% |
| Immigrants | Kuwait | 99.9 /100 | #41 | Exceptional 70.3% |
| Immigrants | Lithuania | 99.9 /100 | #42 | Exceptional 70.3% |
| Israelis | 99.9 /100 | #43 | Exceptional 70.2% |
| New Zealanders | 99.9 /100 | #44 | Exceptional 70.2% |
| Immigrants | Norway | 99.9 /100 | #45 | Exceptional 70.2% |
| Immigrants | Latvia | 99.9 /100 | #46 | Exceptional 70.1% |
| Immigrants | Bulgaria | 99.8 /100 | #47 | Exceptional 70.0% |
| Immigrants | Netherlands | 99.8 /100 | #48 | Exceptional 70.0% |
| Immigrants | Austria | 99.8 /100 | #49 | Exceptional 70.0% |
| Zimbabweans | 99.8 /100 | #50 | Exceptional 69.9% |
| Mongolians | 99.8 /100 | #51 | Exceptional 69.9% |
| Immigrants | Russia | 99.8 /100 | #52 | Exceptional 69.9% |
| South Africans | 99.7 /100 | #53 | Exceptional 69.7% |
| Immigrants | Czechoslovakia | 99.7 /100 | #54 | Exceptional 69.6% |
| Maltese | 99.7 /100 | #55 | Exceptional 69.5% |