Immigrants from Trinidad and Tobago vs American Doctorate Degree
COMPARE
Immigrants from Trinidad and Tobago
American
Doctorate Degree
Doctorate Degree Comparison
Immigrants from Trinidad and Tobago
Americans
1.5%
DOCTORATE DEGREE
0.5/ 100
METRIC RATING
271st/ 347
METRIC RANK
1.5%
DOCTORATE DEGREE
1.0/ 100
METRIC RATING
253rd/ 347
METRIC RANK
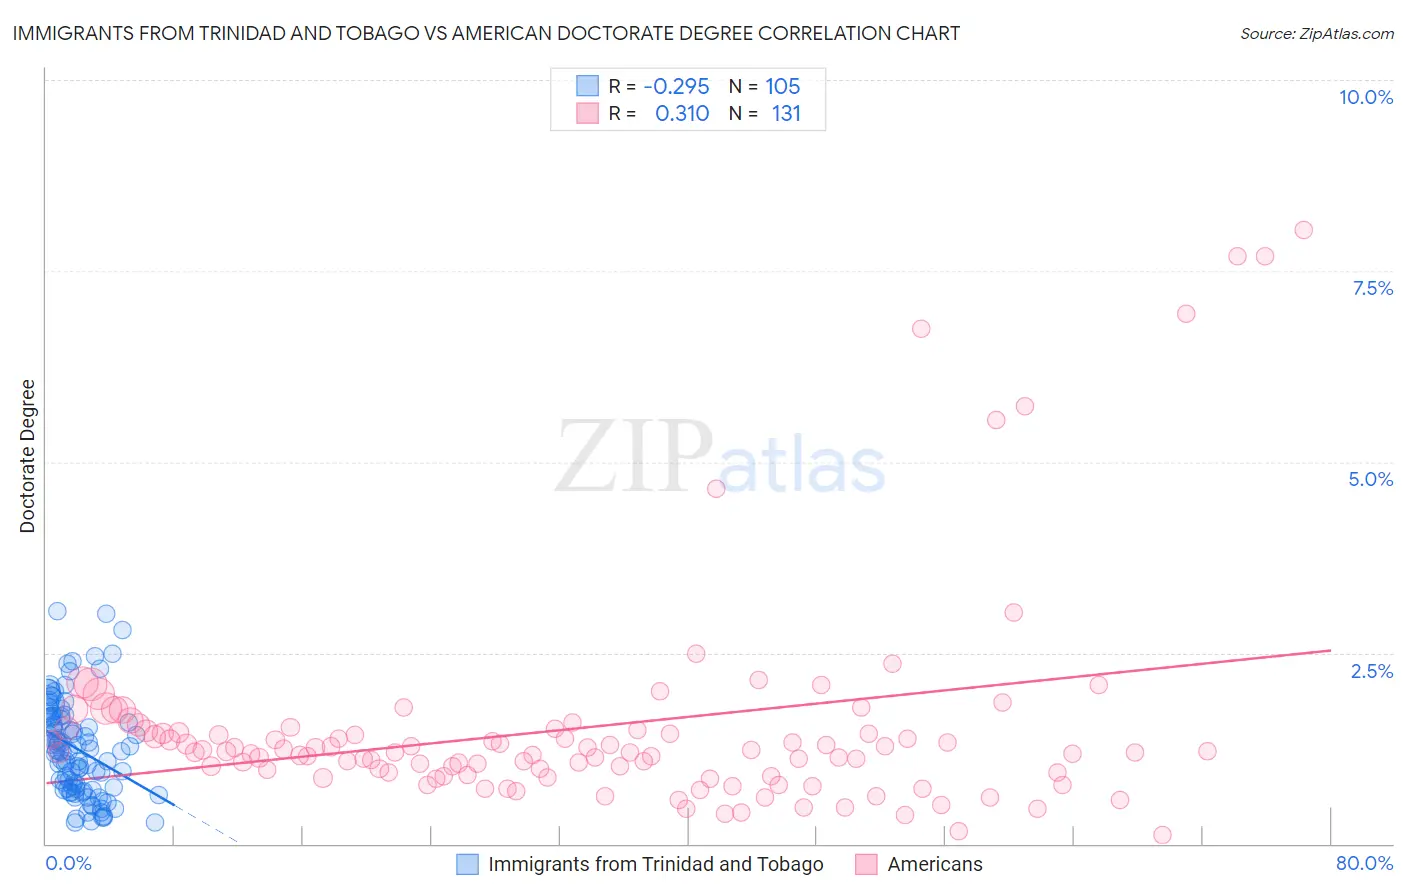
Immigrants from Trinidad and Tobago vs American Doctorate Degree Correlation Chart
The statistical analysis conducted on geographies consisting of 222,674,417 people shows a weak negative correlation between the proportion of Immigrants from Trinidad and Tobago and percentage of population with at least doctorate degree education in the United States with a correlation coefficient (R) of -0.295 and weighted average of 1.5%. Similarly, the statistical analysis conducted on geographies consisting of 552,800,841 people shows a mild positive correlation between the proportion of Americans and percentage of population with at least doctorate degree education in the United States with a correlation coefficient (R) of 0.310 and weighted average of 1.5%, a difference of 3.7%.
Doctorate Degree Correlation Summary
| Measurement | Immigrants from Trinidad and Tobago | American |
| Minimum | 0.28% | 0.12% |
| Maximum | 3.0% | 8.0% |
| Range | 2.8% | 7.9% |
| Mean | 1.2% | 1.5% |
| Median | 1.2% | 1.2% |
| Interquartile 25% (IQ1) | 0.71% | 0.90% |
| Interquartile 75% (IQ3) | 1.6% | 1.5% |
| Interquartile Range (IQR) | 0.93% | 0.58% |
| Standard Deviation (Sample) | 0.63% | 1.4% |
| Standard Deviation (Population) | 0.63% | 1.4% |
Demographics Similar to Immigrants from Trinidad and Tobago and Americans by Doctorate Degree
In terms of doctorate degree, the demographic groups most similar to Immigrants from Trinidad and Tobago are Salvadoran (1.5%, a difference of 0.070%), Immigrants from Barbados (1.5%, a difference of 0.090%), Crow (1.5%, a difference of 0.10%), Kiowa (1.5%, a difference of 0.19%), and U.S. Virgin Islander (1.5%, a difference of 0.19%). Similarly, the demographic groups most similar to Americans are Immigrants from Cambodia (1.5%, a difference of 0.13%), Trinidadian and Tobagonian (1.5%, a difference of 0.13%), Yuman (1.5%, a difference of 0.15%), Central American Indian (1.5%, a difference of 0.18%), and Chippewa (1.5%, a difference of 0.40%).
| Demographics | Rating | Rank | Doctorate Degree |
| Yuman | 1.1 /100 | #252 | Tragic 1.5% |
| Americans | 1.0 /100 | #253 | Tragic 1.5% |
| Immigrants | Cambodia | 1.0 /100 | #254 | Tragic 1.5% |
| Trinidadians and Tobagonians | 1.0 /100 | #255 | Tragic 1.5% |
| Central American Indians | 1.0 /100 | #256 | Tragic 1.5% |
| Chippewa | 0.9 /100 | #257 | Tragic 1.5% |
| Immigrants | West Indies | 0.9 /100 | #258 | Tragic 1.5% |
| Liberians | 0.9 /100 | #259 | Tragic 1.5% |
| Japanese | 0.9 /100 | #260 | Tragic 1.5% |
| Immigrants | Portugal | 0.8 /100 | #261 | Tragic 1.5% |
| Chickasaw | 0.7 /100 | #262 | Tragic 1.5% |
| Immigrants | Bahamas | 0.7 /100 | #263 | Tragic 1.5% |
| Blackfeet | 0.7 /100 | #264 | Tragic 1.5% |
| Nicaraguans | 0.6 /100 | #265 | Tragic 1.5% |
| Immigrants | Liberia | 0.5 /100 | #266 | Tragic 1.5% |
| Kiowa | 0.5 /100 | #267 | Tragic 1.5% |
| U.S. Virgin Islanders | 0.5 /100 | #268 | Tragic 1.5% |
| Crow | 0.5 /100 | #269 | Tragic 1.5% |
| Salvadorans | 0.5 /100 | #270 | Tragic 1.5% |
| Immigrants | Trinidad and Tobago | 0.5 /100 | #271 | Tragic 1.5% |
| Immigrants | Barbados | 0.4 /100 | #272 | Tragic 1.5% |