Immigrants from Trinidad and Tobago vs Soviet Union Unemployment Among Ages 60 to 64 years
COMPARE
Immigrants from Trinidad and Tobago
Soviet Union
Unemployment Among Ages 60 to 64 years
Unemployment Among Ages 60 to 64 years Comparison
Immigrants from Trinidad and Tobago
Soviet Union
5.3%
UNEMPLOYMENT AMONG AGES 60 TO 64 YEARS
0.0/ 100
METRIC RATING
290th/ 347
METRIC RANK
5.4%
UNEMPLOYMENT AMONG AGES 60 TO 64 YEARS
0.0/ 100
METRIC RATING
309th/ 347
METRIC RANK
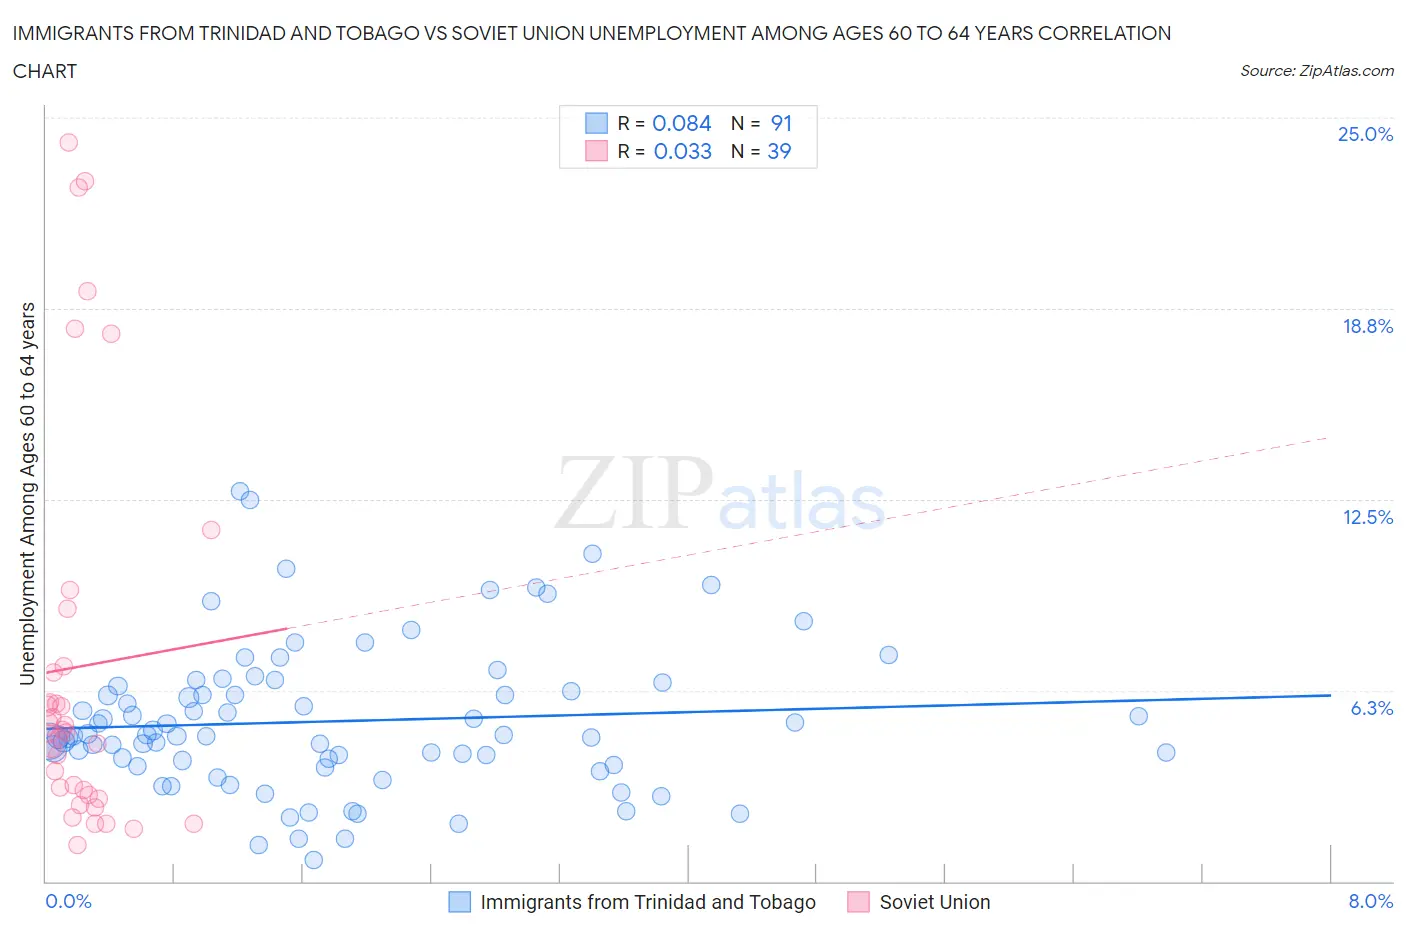
Immigrants from Trinidad and Tobago vs Soviet Union Unemployment Among Ages 60 to 64 years Correlation Chart
The statistical analysis conducted on geographies consisting of 212,065,319 people shows a slight positive correlation between the proportion of Immigrants from Trinidad and Tobago and unemployment rate among population between the ages 60 and 64 in the United States with a correlation coefficient (R) of 0.084 and weighted average of 5.3%. Similarly, the statistical analysis conducted on geographies consisting of 43,137,062 people shows no correlation between the proportion of Soviet Union and unemployment rate among population between the ages 60 and 64 in the United States with a correlation coefficient (R) of 0.033 and weighted average of 5.4%, a difference of 2.2%.
Unemployment Among Ages 60 to 64 years Correlation Summary
| Measurement | Immigrants from Trinidad and Tobago | Soviet Union |
| Minimum | 0.70% | 1.2% |
| Maximum | 12.8% | 24.2% |
| Range | 12.1% | 23.0% |
| Mean | 5.2% | 7.0% |
| Median | 4.8% | 4.9% |
| Interquartile 25% (IQ1) | 3.8% | 2.8% |
| Interquartile 75% (IQ3) | 6.4% | 7.0% |
| Interquartile Range (IQR) | 2.6% | 4.2% |
| Standard Deviation (Sample) | 2.4% | 6.4% |
| Standard Deviation (Population) | 2.4% | 6.4% |
Demographics Similar to Immigrants from Trinidad and Tobago and Soviet Union by Unemployment Among Ages 60 to 64 years
In terms of unemployment among ages 60 to 64 years, the demographic groups most similar to Immigrants from Trinidad and Tobago are Spanish American (5.3%, a difference of 0.030%), Hispanic or Latino (5.3%, a difference of 0.32%), Immigrants from Latin America (5.3%, a difference of 0.33%), Immigrants from Israel (5.3%, a difference of 0.35%), and Black/African American (5.3%, a difference of 0.46%). Similarly, the demographic groups most similar to Soviet Union are Spanish American Indian (5.4%, a difference of 0.010%), Immigrants from Guyana (5.4%, a difference of 0.020%), Immigrants from Dominica (5.4%, a difference of 0.19%), Cypriot (5.4%, a difference of 0.26%), and Immigrants from Mexico (5.4%, a difference of 0.28%).
| Demographics | Rating | Rank | Unemployment Among Ages 60 to 64 years |
| Spanish Americans | 0.0 /100 | #289 | Tragic 5.3% |
| Immigrants | Trinidad and Tobago | 0.0 /100 | #290 | Tragic 5.3% |
| Hispanics or Latinos | 0.0 /100 | #291 | Tragic 5.3% |
| Immigrants | Latin America | 0.0 /100 | #292 | Tragic 5.3% |
| Immigrants | Israel | 0.0 /100 | #293 | Tragic 5.3% |
| Blacks/African Americans | 0.0 /100 | #294 | Tragic 5.3% |
| Armenians | 0.0 /100 | #295 | Tragic 5.3% |
| Jamaicans | 0.0 /100 | #296 | Tragic 5.3% |
| Osage | 0.0 /100 | #297 | Tragic 5.4% |
| Immigrants | Central America | 0.0 /100 | #298 | Tragic 5.4% |
| Immigrants | El Salvador | 0.0 /100 | #299 | Tragic 5.4% |
| Immigrants | Barbados | 0.0 /100 | #300 | Tragic 5.4% |
| Immigrants | Jamaica | 0.0 /100 | #301 | Tragic 5.4% |
| Barbadians | 0.0 /100 | #302 | Tragic 5.4% |
| Bahamians | 0.0 /100 | #303 | Tragic 5.4% |
| Immigrants | Mexico | 0.0 /100 | #304 | Tragic 5.4% |
| Cypriots | 0.0 /100 | #305 | Tragic 5.4% |
| Immigrants | Dominica | 0.0 /100 | #306 | Tragic 5.4% |
| Immigrants | Guyana | 0.0 /100 | #307 | Tragic 5.4% |
| Spanish American Indians | 0.0 /100 | #308 | Tragic 5.4% |
| Soviet Union | 0.0 /100 | #309 | Tragic 5.4% |