Immigrants from Thailand vs Slavic Family Poverty
COMPARE
Immigrants from Thailand
Slavic
Family Poverty
Family Poverty Comparison
Immigrants from Thailand
Slavs
9.7%
FAMILY POVERTY
9.7/ 100
METRIC RATING
212th/ 347
METRIC RANK
8.1%
FAMILY POVERTY
95.6/ 100
METRIC RATING
104th/ 347
METRIC RANK
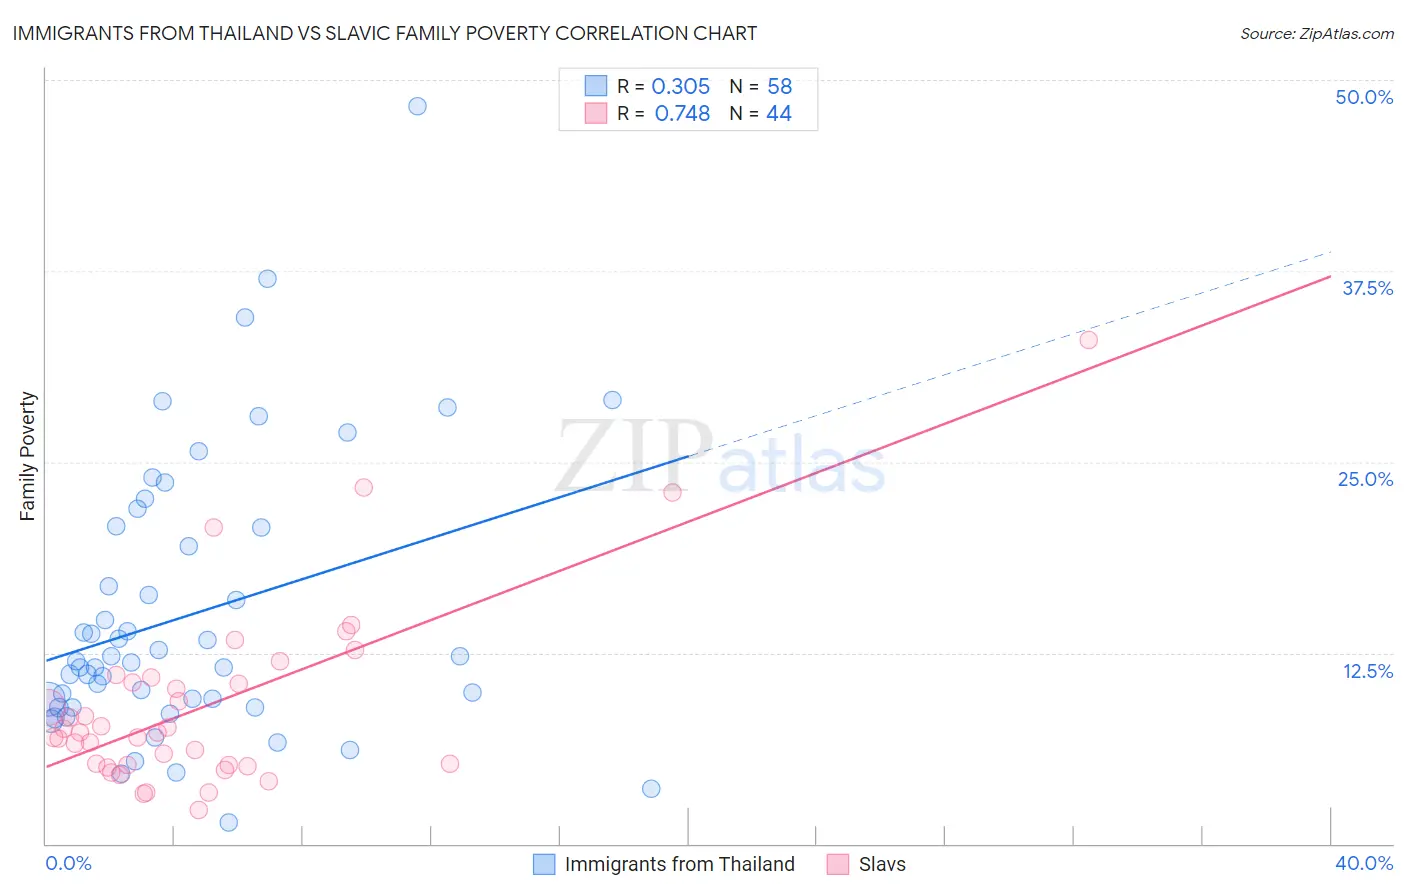
Immigrants from Thailand vs Slavic Family Poverty Correlation Chart
The statistical analysis conducted on geographies consisting of 316,654,872 people shows a mild positive correlation between the proportion of Immigrants from Thailand and poverty level among families in the United States with a correlation coefficient (R) of 0.305 and weighted average of 9.7%. Similarly, the statistical analysis conducted on geographies consisting of 270,374,378 people shows a strong positive correlation between the proportion of Slavs and poverty level among families in the United States with a correlation coefficient (R) of 0.748 and weighted average of 8.1%, a difference of 19.3%.
Family Poverty Correlation Summary
| Measurement | Immigrants from Thailand | Slavic |
| Minimum | 1.4% | 2.2% |
| Maximum | 48.3% | 33.0% |
| Range | 46.9% | 30.8% |
| Mean | 15.0% | 9.1% |
| Median | 11.9% | 7.3% |
| Interquartile 25% (IQ1) | 8.9% | 5.2% |
| Interquartile 75% (IQ3) | 20.7% | 10.7% |
| Interquartile Range (IQR) | 11.8% | 5.5% |
| Standard Deviation (Sample) | 9.2% | 6.1% |
| Standard Deviation (Population) | 9.1% | 6.0% |
Similar Demographics by Family Poverty
Demographics Similar to Immigrants from Thailand by Family Poverty
In terms of family poverty, the demographic groups most similar to Immigrants from Thailand are Malaysian (9.6%, a difference of 0.30%), Alsatian (9.6%, a difference of 0.54%), Osage (9.7%, a difference of 0.63%), Immigrants from Micronesia (9.8%, a difference of 1.2%), and Nonimmigrants (9.8%, a difference of 1.2%).
| Demographics | Rating | Rank | Family Poverty |
| Aleuts | 18.0 /100 | #205 | Poor 9.5% |
| Immigrants | South America | 18.0 /100 | #206 | Poor 9.5% |
| Sierra Leoneans | 15.6 /100 | #207 | Poor 9.5% |
| Immigrants | Eastern Africa | 15.1 /100 | #208 | Poor 9.5% |
| Immigrants | Uruguay | 14.0 /100 | #209 | Poor 9.5% |
| Alsatians | 11.3 /100 | #210 | Poor 9.6% |
| Malaysians | 10.6 /100 | #211 | Poor 9.6% |
| Immigrants | Thailand | 9.7 /100 | #212 | Tragic 9.7% |
| Osage | 8.0 /100 | #213 | Tragic 9.7% |
| Immigrants | Micronesia | 6.7 /100 | #214 | Tragic 9.8% |
| Immigrants | Nonimmigrants | 6.7 /100 | #215 | Tragic 9.8% |
| Moroccans | 6.5 /100 | #216 | Tragic 9.8% |
| Americans | 6.2 /100 | #217 | Tragic 9.8% |
| Panamanians | 5.6 /100 | #218 | Tragic 9.8% |
| Immigrants | Eritrea | 5.4 /100 | #219 | Tragic 9.9% |
Demographics Similar to Slavs by Family Poverty
In terms of family poverty, the demographic groups most similar to Slavs are Immigrants from Eastern Europe (8.1%, a difference of 0.010%), Laotian (8.1%, a difference of 0.030%), Immigrants from Indonesia (8.1%, a difference of 0.10%), Immigrants from Norway (8.1%, a difference of 0.11%), and New Zealander (8.1%, a difference of 0.14%).
| Demographics | Rating | Rank | Family Poverty |
| Immigrants | Switzerland | 96.1 /100 | #97 | Exceptional 8.1% |
| Immigrants | South Africa | 95.9 /100 | #98 | Exceptional 8.1% |
| Welsh | 95.8 /100 | #99 | Exceptional 8.1% |
| New Zealanders | 95.8 /100 | #100 | Exceptional 8.1% |
| Immigrants | Norway | 95.7 /100 | #101 | Exceptional 8.1% |
| Immigrants | Indonesia | 95.7 /100 | #102 | Exceptional 8.1% |
| Immigrants | Eastern Europe | 95.6 /100 | #103 | Exceptional 8.1% |
| Slavs | 95.6 /100 | #104 | Exceptional 8.1% |
| Laotians | 95.6 /100 | #105 | Exceptional 8.1% |
| Egyptians | 95.1 /100 | #106 | Exceptional 8.1% |
| French Canadians | 95.0 /100 | #107 | Exceptional 8.1% |
| Basques | 94.9 /100 | #108 | Exceptional 8.1% |
| Jordanians | 94.8 /100 | #109 | Exceptional 8.2% |
| Romanians | 94.7 /100 | #110 | Exceptional 8.2% |
| Taiwanese | 94.6 /100 | #111 | Exceptional 8.2% |