Cheyenne vs Immigrants from Bolivia GED/Equivalency
COMPARE
Cheyenne
Immigrants from Bolivia
GED/Equivalency
GED/Equivalency Comparison
Cheyenne
Immigrants from Bolivia
82.7%
GED/EQUIVALENCY
0.1/ 100
METRIC RATING
280th/ 347
METRIC RANK
85.8%
GED/EQUIVALENCY
49.8/ 100
METRIC RATING
175th/ 347
METRIC RANK
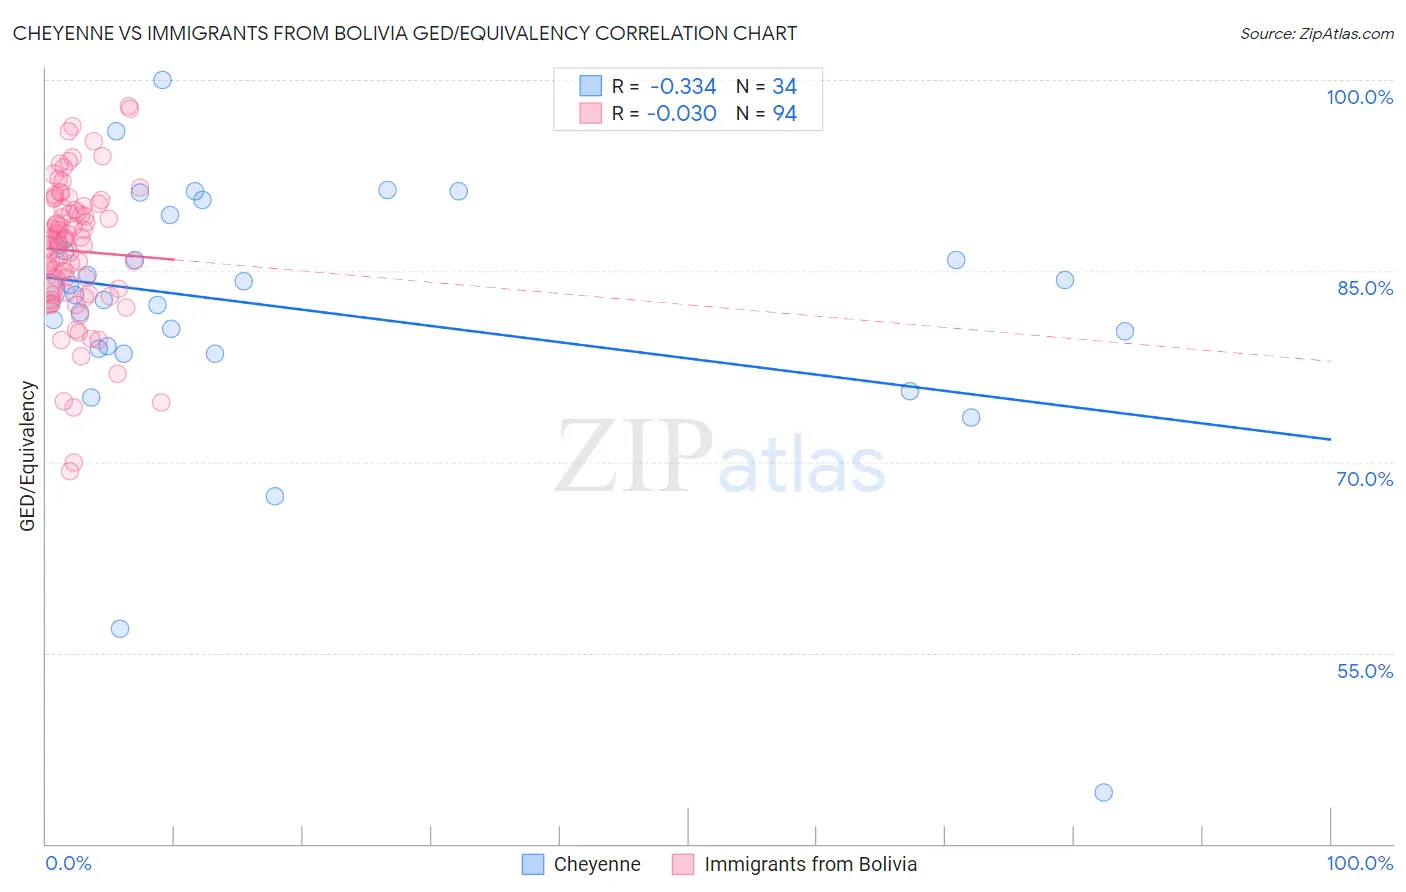
Cheyenne vs Immigrants from Bolivia GED/Equivalency Correlation Chart
The statistical analysis conducted on geographies consisting of 80,719,411 people shows a mild negative correlation between the proportion of Cheyenne and percentage of population with at least ged/equivalency education in the United States with a correlation coefficient (R) of -0.334 and weighted average of 82.7%. Similarly, the statistical analysis conducted on geographies consisting of 158,730,894 people shows no correlation between the proportion of Immigrants from Bolivia and percentage of population with at least ged/equivalency education in the United States with a correlation coefficient (R) of -0.030 and weighted average of 85.8%, a difference of 3.7%.
GED/Equivalency Correlation Summary
| Measurement | Cheyenne | Immigrants from Bolivia |
| Minimum | 44.1% | 69.3% |
| Maximum | 100.0% | 98.0% |
| Range | 55.9% | 28.7% |
| Mean | 81.9% | 86.6% |
| Median | 83.3% | 87.5% |
| Interquartile 25% (IQ1) | 78.8% | 83.3% |
| Interquartile 75% (IQ3) | 87.0% | 90.0% |
| Interquartile Range (IQR) | 8.2% | 6.7% |
| Standard Deviation (Sample) | 10.4% | 5.5% |
| Standard Deviation (Population) | 10.3% | 5.4% |
Similar Demographics by GED/Equivalency
Demographics Similar to Cheyenne by GED/Equivalency
In terms of ged/equivalency, the demographic groups most similar to Cheyenne are Immigrants from Laos (82.7%, a difference of 0.010%), Immigrants from Fiji (82.7%, a difference of 0.010%), Arapaho (82.8%, a difference of 0.050%), Black/African American (82.8%, a difference of 0.060%), and Seminole (82.8%, a difference of 0.090%).
| Demographics | Rating | Rank | GED/Equivalency |
| Pennsylvania Germans | 0.1 /100 | #273 | Tragic 82.9% |
| Immigrants | Trinidad and Tobago | 0.1 /100 | #274 | Tragic 82.8% |
| Seminole | 0.1 /100 | #275 | Tragic 82.8% |
| Blacks/African Americans | 0.1 /100 | #276 | Tragic 82.8% |
| Arapaho | 0.1 /100 | #277 | Tragic 82.8% |
| Immigrants | Laos | 0.1 /100 | #278 | Tragic 82.7% |
| Immigrants | Fiji | 0.1 /100 | #279 | Tragic 82.7% |
| Cheyenne | 0.1 /100 | #280 | Tragic 82.7% |
| Sioux | 0.1 /100 | #281 | Tragic 82.6% |
| Immigrants | Immigrants | 0.1 /100 | #282 | Tragic 82.6% |
| Indonesians | 0.1 /100 | #283 | Tragic 82.5% |
| Immigrants | Barbados | 0.1 /100 | #284 | Tragic 82.4% |
| Cajuns | 0.0 /100 | #285 | Tragic 82.4% |
| Immigrants | West Indies | 0.0 /100 | #286 | Tragic 82.4% |
| Japanese | 0.0 /100 | #287 | Tragic 82.4% |
Demographics Similar to Immigrants from Bolivia by GED/Equivalency
In terms of ged/equivalency, the demographic groups most similar to Immigrants from Bolivia are Ottawa (85.8%, a difference of 0.0%), Immigrants from Venezuela (85.8%, a difference of 0.020%), Immigrants from Eastern Africa (85.7%, a difference of 0.040%), Immigrants from Uganda (85.7%, a difference of 0.10%), and Bermudan (85.8%, a difference of 0.11%).
| Demographics | Rating | Rank | GED/Equivalency |
| Sierra Leoneans | 61.8 /100 | #168 | Good 86.0% |
| Immigrants | Ethiopia | 61.2 /100 | #169 | Good 86.0% |
| Afghans | 59.7 /100 | #170 | Average 85.9% |
| Immigrants | Chile | 57.3 /100 | #171 | Average 85.9% |
| Bermudans | 55.1 /100 | #172 | Average 85.8% |
| Immigrants | Venezuela | 50.7 /100 | #173 | Average 85.8% |
| Ottawa | 50.0 /100 | #174 | Average 85.8% |
| Immigrants | Bolivia | 49.8 /100 | #175 | Average 85.8% |
| Immigrants | Eastern Africa | 47.7 /100 | #176 | Average 85.7% |
| Immigrants | Uganda | 45.2 /100 | #177 | Average 85.7% |
| Koreans | 41.2 /100 | #178 | Average 85.6% |
| Aleuts | 40.5 /100 | #179 | Average 85.6% |
| Immigrants | Southern Europe | 38.4 /100 | #180 | Fair 85.5% |
| Moroccans | 37.7 /100 | #181 | Fair 85.5% |
| Sudanese | 35.2 /100 | #182 | Fair 85.5% |