Immigrants from Sudan vs Ugandan Unemployment Among Youth under 25 years
COMPARE
Immigrants from Sudan
Ugandan
Unemployment Among Youth under 25 years
Unemployment Among Youth under 25 years Comparison
Immigrants from Sudan
Ugandans
10.5%
UNEMPLOYMENT AMONG YOUTH UNDER 25 YEARS
100.0/ 100
METRIC RATING
12th/ 347
METRIC RANK
11.6%
UNEMPLOYMENT AMONG YOUTH UNDER 25 YEARS
45.6/ 100
METRIC RATING
176th/ 347
METRIC RANK
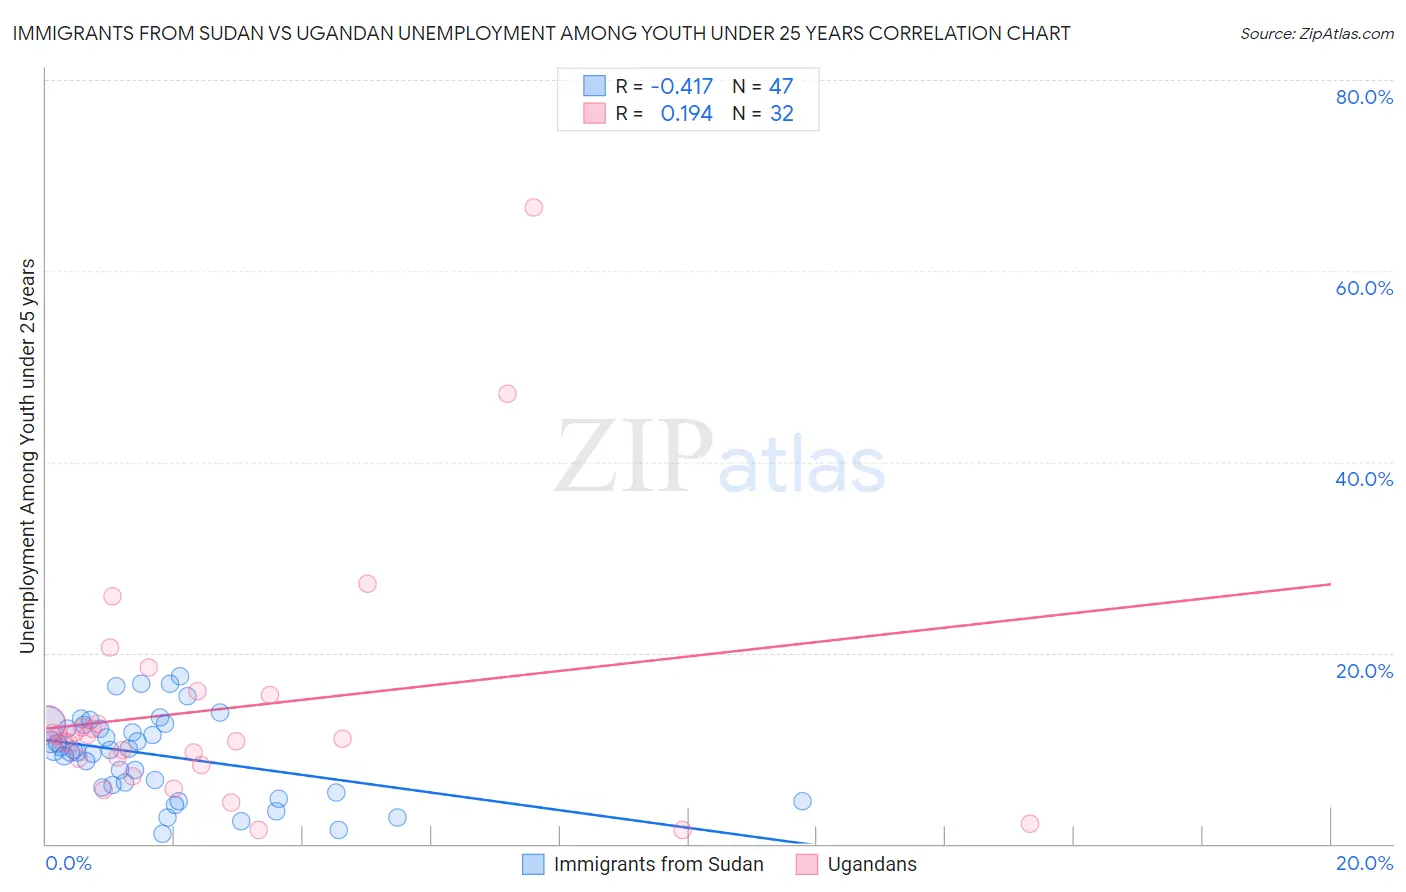
Immigrants from Sudan vs Ugandan Unemployment Among Youth under 25 years Correlation Chart
The statistical analysis conducted on geographies consisting of 118,803,399 people shows a moderate negative correlation between the proportion of Immigrants from Sudan and unemployment rate among youth under the age of 25 in the United States with a correlation coefficient (R) of -0.417 and weighted average of 10.5%. Similarly, the statistical analysis conducted on geographies consisting of 93,873,429 people shows a poor positive correlation between the proportion of Ugandans and unemployment rate among youth under the age of 25 in the United States with a correlation coefficient (R) of 0.194 and weighted average of 11.6%, a difference of 10.2%.
Unemployment Among Youth under 25 years Correlation Summary
| Measurement | Immigrants from Sudan | Ugandan |
| Minimum | 1.1% | 1.4% |
| Maximum | 17.5% | 66.6% |
| Range | 16.4% | 65.2% |
| Mean | 9.3% | 14.0% |
| Median | 9.8% | 11.2% |
| Interquartile 25% (IQ1) | 5.8% | 8.6% |
| Interquartile 75% (IQ3) | 12.4% | 14.1% |
| Interquartile Range (IQR) | 6.6% | 5.5% |
| Standard Deviation (Sample) | 4.3% | 12.9% |
| Standard Deviation (Population) | 4.3% | 12.7% |
Similar Demographics by Unemployment Among Youth under 25 years
Demographics Similar to Immigrants from Sudan by Unemployment Among Youth under 25 years
In terms of unemployment among youth under 25 years, the demographic groups most similar to Immigrants from Sudan are Indonesian (10.6%, a difference of 0.12%), Cuban (10.6%, a difference of 0.14%), Scandinavian (10.5%, a difference of 0.18%), Sudanese (10.6%, a difference of 0.25%), and Venezuelan (10.6%, a difference of 0.26%).
| Demographics | Rating | Rank | Unemployment Among Youth under 25 years |
| Czechs | 100.0 /100 | #5 | Exceptional 10.3% |
| Danes | 100.0 /100 | #6 | Exceptional 10.3% |
| Swedes | 100.0 /100 | #7 | Exceptional 10.4% |
| Immigrants | Venezuela | 100.0 /100 | #8 | Exceptional 10.5% |
| Germans | 100.0 /100 | #9 | Exceptional 10.5% |
| Immigrants | Somalia | 100.0 /100 | #10 | Exceptional 10.5% |
| Scandinavians | 100.0 /100 | #11 | Exceptional 10.5% |
| Immigrants | Sudan | 100.0 /100 | #12 | Exceptional 10.5% |
| Indonesians | 100.0 /100 | #13 | Exceptional 10.6% |
| Cubans | 100.0 /100 | #14 | Exceptional 10.6% |
| Sudanese | 100.0 /100 | #15 | Exceptional 10.6% |
| Venezuelans | 100.0 /100 | #16 | Exceptional 10.6% |
| Menominee | 100.0 /100 | #17 | Exceptional 10.6% |
| Swiss | 100.0 /100 | #18 | Exceptional 10.6% |
| Immigrants | Burma/Myanmar | 100.0 /100 | #19 | Exceptional 10.6% |
Demographics Similar to Ugandans by Unemployment Among Youth under 25 years
In terms of unemployment among youth under 25 years, the demographic groups most similar to Ugandans are Immigrants from Denmark (11.6%, a difference of 0.030%), Immigrants from Iraq (11.6%, a difference of 0.060%), Immigrants from Europe (11.6%, a difference of 0.13%), Immigrants from Hong Kong (11.6%, a difference of 0.13%), and Immigrants from China (11.6%, a difference of 0.18%).
| Demographics | Rating | Rank | Unemployment Among Youth under 25 years |
| Eastern Europeans | 57.5 /100 | #169 | Average 11.6% |
| Russians | 57.3 /100 | #170 | Average 11.6% |
| Bangladeshis | 55.6 /100 | #171 | Average 11.6% |
| Immigrants | Morocco | 55.1 /100 | #172 | Average 11.6% |
| Immigrants | South Eastern Asia | 51.7 /100 | #173 | Average 11.6% |
| Immigrants | China | 50.0 /100 | #174 | Average 11.6% |
| Immigrants | Iraq | 47.0 /100 | #175 | Average 11.6% |
| Ugandans | 45.6 /100 | #176 | Average 11.6% |
| Immigrants | Denmark | 45.0 /100 | #177 | Average 11.6% |
| Immigrants | Europe | 42.4 /100 | #178 | Average 11.6% |
| Immigrants | Hong Kong | 42.4 /100 | #179 | Average 11.6% |
| Spaniards | 39.8 /100 | #180 | Fair 11.7% |
| Syrians | 38.4 /100 | #181 | Fair 11.7% |
| Immigrants | Italy | 36.2 /100 | #182 | Fair 11.7% |
| Americans | 34.5 /100 | #183 | Fair 11.7% |