Immigrants from Sudan vs Immigrants from Bosnia and Herzegovina 9th Grade
COMPARE
Immigrants from Sudan
Immigrants from Bosnia and Herzegovina
9th Grade
9th Grade Comparison
Immigrants from Sudan
Immigrants from Bosnia and Herzegovina
94.6%
9TH GRADE
17.6/ 100
METRIC RATING
205th/ 347
METRIC RANK
95.2%
9TH GRADE
85.2/ 100
METRIC RATING
141st/ 347
METRIC RANK
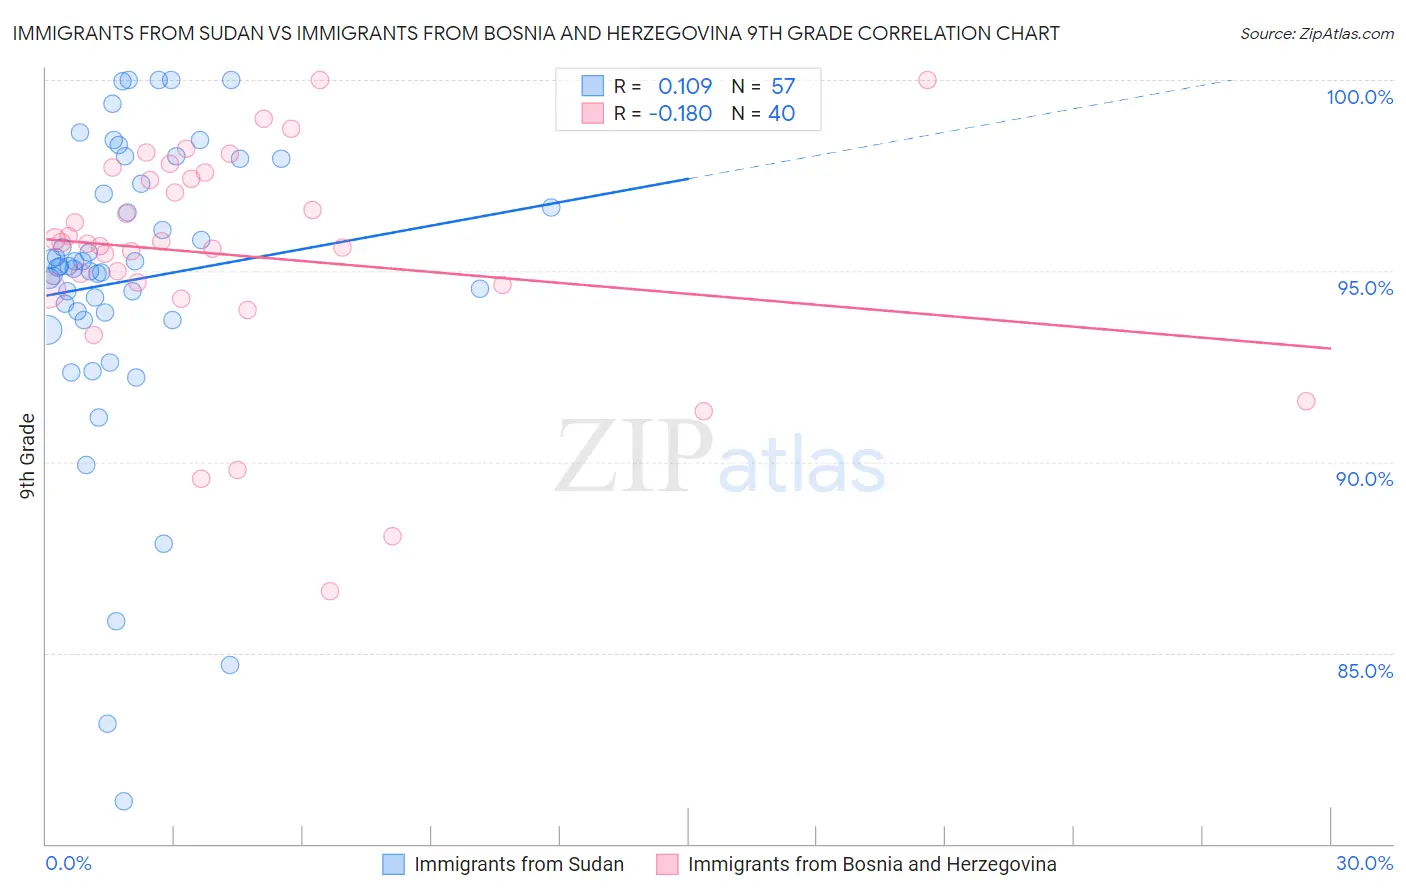
Immigrants from Sudan vs Immigrants from Bosnia and Herzegovina 9th Grade Correlation Chart
The statistical analysis conducted on geographies consisting of 118,959,807 people shows a poor positive correlation between the proportion of Immigrants from Sudan and percentage of population with at least 9th grade education in the United States with a correlation coefficient (R) of 0.109 and weighted average of 94.6%. Similarly, the statistical analysis conducted on geographies consisting of 156,819,615 people shows a poor negative correlation between the proportion of Immigrants from Bosnia and Herzegovina and percentage of population with at least 9th grade education in the United States with a correlation coefficient (R) of -0.180 and weighted average of 95.2%, a difference of 0.61%.
9th Grade Correlation Summary
| Measurement | Immigrants from Sudan | Immigrants from Bosnia and Herzegovina |
| Minimum | 81.1% | 86.6% |
| Maximum | 100.0% | 100.0% |
| Range | 18.9% | 13.4% |
| Mean | 94.8% | 95.4% |
| Median | 95.1% | 95.7% |
| Interquartile 25% (IQ1) | 93.8% | 94.6% |
| Interquartile 75% (IQ3) | 97.6% | 97.5% |
| Interquartile Range (IQR) | 3.8% | 2.9% |
| Standard Deviation (Sample) | 4.0% | 3.0% |
| Standard Deviation (Population) | 4.0% | 3.0% |
Similar Demographics by 9th Grade
Demographics Similar to Immigrants from Sudan by 9th Grade
In terms of 9th grade, the demographic groups most similar to Immigrants from Sudan are Samoan (94.6%, a difference of 0.0%), Moroccan (94.6%, a difference of 0.020%), Immigrants from Morocco (94.6%, a difference of 0.020%), Immigrants from Zaire (94.6%, a difference of 0.030%), and Black/African American (94.6%, a difference of 0.030%).
| Demographics | Rating | Rank | 9th Grade |
| Hawaiians | 22.7 /100 | #198 | Fair 94.7% |
| Laotians | 21.0 /100 | #199 | Fair 94.6% |
| Immigrants | Zaire | 20.6 /100 | #200 | Fair 94.6% |
| Blacks/African Americans | 20.5 /100 | #201 | Fair 94.6% |
| Immigrants | Eastern Asia | 19.8 /100 | #202 | Poor 94.6% |
| Immigrants | Bahamas | 19.8 /100 | #203 | Poor 94.6% |
| Moroccans | 19.6 /100 | #204 | Poor 94.6% |
| Immigrants | Sudan | 17.6 /100 | #205 | Poor 94.6% |
| Samoans | 17.3 /100 | #206 | Poor 94.6% |
| Immigrants | Morocco | 16.3 /100 | #207 | Poor 94.6% |
| Immigrants | Pakistan | 15.5 /100 | #208 | Poor 94.6% |
| Comanche | 14.9 /100 | #209 | Poor 94.6% |
| Immigrants | Chile | 13.4 /100 | #210 | Poor 94.5% |
| Immigrants | Indonesia | 12.3 /100 | #211 | Poor 94.5% |
| Immigrants | Malaysia | 12.2 /100 | #212 | Poor 94.5% |
Demographics Similar to Immigrants from Bosnia and Herzegovina by 9th Grade
In terms of 9th grade, the demographic groups most similar to Immigrants from Bosnia and Herzegovina are Immigrants from Taiwan (95.2%, a difference of 0.0%), Immigrants from Eastern Europe (95.2%, a difference of 0.010%), Immigrants from Greece (95.2%, a difference of 0.010%), Spanish (95.2%, a difference of 0.010%), and Immigrants from Russia (95.2%, a difference of 0.020%).
| Demographics | Rating | Rank | 9th Grade |
| Immigrants | Israel | 89.6 /100 | #134 | Excellent 95.3% |
| Immigrants | Belarus | 88.9 /100 | #135 | Excellent 95.2% |
| Immigrants | Iran | 88.3 /100 | #136 | Excellent 95.2% |
| Hmong | 87.7 /100 | #137 | Excellent 95.2% |
| Immigrants | Russia | 86.6 /100 | #138 | Excellent 95.2% |
| Immigrants | Eastern Europe | 85.8 /100 | #139 | Excellent 95.2% |
| Immigrants | Taiwan | 85.3 /100 | #140 | Excellent 95.2% |
| Immigrants | Bosnia and Herzegovina | 85.2 /100 | #141 | Excellent 95.2% |
| Immigrants | Greece | 84.6 /100 | #142 | Excellent 95.2% |
| Spanish | 84.4 /100 | #143 | Excellent 95.2% |
| Yup'ik | 83.3 /100 | #144 | Excellent 95.2% |
| Pueblo | 82.2 /100 | #145 | Excellent 95.1% |
| Immigrants | Sri Lanka | 82.1 /100 | #146 | Excellent 95.1% |
| Choctaw | 81.9 /100 | #147 | Excellent 95.1% |
| Immigrants | Jordan | 81.2 /100 | #148 | Excellent 95.1% |