Immigrants from Sudan vs Immigrants from Eastern Africa 9th Grade
COMPARE
Immigrants from Sudan
Immigrants from Eastern Africa
9th Grade
9th Grade Comparison
Immigrants from Sudan
Immigrants from Eastern Africa
94.6%
9TH GRADE
17.6/ 100
METRIC RATING
205th/ 347
METRIC RANK
94.5%
9TH GRADE
8.2/ 100
METRIC RATING
221st/ 347
METRIC RANK
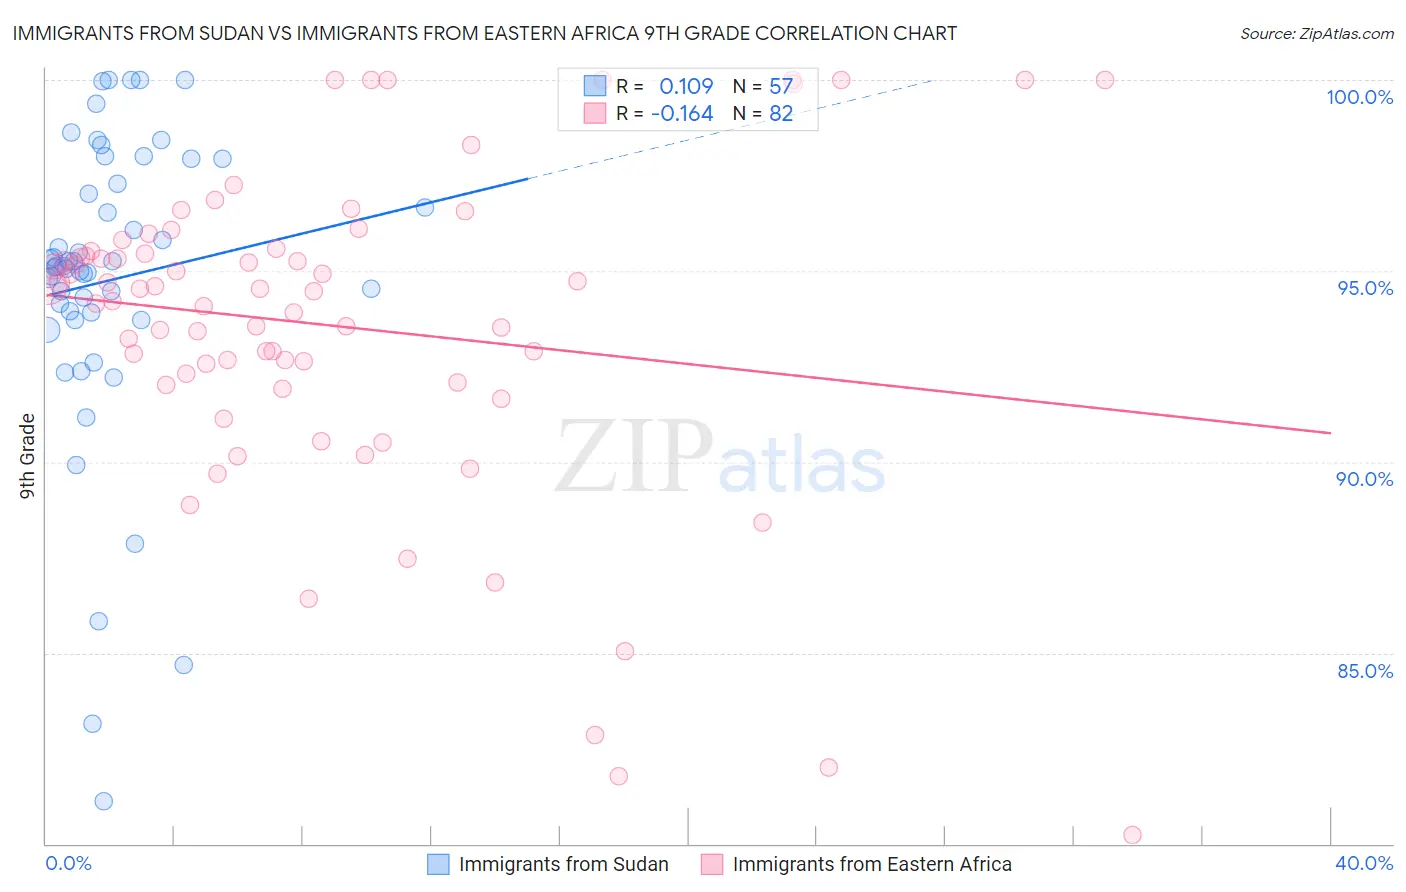
Immigrants from Sudan vs Immigrants from Eastern Africa 9th Grade Correlation Chart
The statistical analysis conducted on geographies consisting of 118,959,807 people shows a poor positive correlation between the proportion of Immigrants from Sudan and percentage of population with at least 9th grade education in the United States with a correlation coefficient (R) of 0.109 and weighted average of 94.6%. Similarly, the statistical analysis conducted on geographies consisting of 355,153,076 people shows a poor negative correlation between the proportion of Immigrants from Eastern Africa and percentage of population with at least 9th grade education in the United States with a correlation coefficient (R) of -0.164 and weighted average of 94.5%, a difference of 0.16%.
9th Grade Correlation Summary
| Measurement | Immigrants from Sudan | Immigrants from Eastern Africa |
| Minimum | 81.1% | 80.2% |
| Maximum | 100.0% | 100.0% |
| Range | 18.9% | 19.8% |
| Mean | 94.8% | 93.6% |
| Median | 95.1% | 94.5% |
| Interquartile 25% (IQ1) | 93.8% | 92.1% |
| Interquartile 75% (IQ3) | 97.6% | 95.5% |
| Interquartile Range (IQR) | 3.8% | 3.5% |
| Standard Deviation (Sample) | 4.0% | 4.2% |
| Standard Deviation (Population) | 4.0% | 4.2% |
Demographics Similar to Immigrants from Sudan and Immigrants from Eastern Africa by 9th Grade
In terms of 9th grade, the demographic groups most similar to Immigrants from Sudan are Samoan (94.6%, a difference of 0.0%), Moroccan (94.6%, a difference of 0.020%), Immigrants from Morocco (94.6%, a difference of 0.020%), Immigrants from Bahamas (94.6%, a difference of 0.030%), and Immigrants from Pakistan (94.6%, a difference of 0.030%). Similarly, the demographic groups most similar to Immigrants from Eastern Africa are Indian (Asian) (94.5%, a difference of 0.010%), Immigrants from Asia (94.4%, a difference of 0.010%), Portuguese (94.5%, a difference of 0.020%), African (94.5%, a difference of 0.020%), and Bahamian (94.4%, a difference of 0.030%).
| Demographics | Rating | Rank | 9th Grade |
| Immigrants | Bahamas | 19.8 /100 | #203 | Poor 94.6% |
| Moroccans | 19.6 /100 | #204 | Poor 94.6% |
| Immigrants | Sudan | 17.6 /100 | #205 | Poor 94.6% |
| Samoans | 17.3 /100 | #206 | Poor 94.6% |
| Immigrants | Morocco | 16.3 /100 | #207 | Poor 94.6% |
| Immigrants | Pakistan | 15.5 /100 | #208 | Poor 94.6% |
| Comanche | 14.9 /100 | #209 | Poor 94.6% |
| Immigrants | Chile | 13.4 /100 | #210 | Poor 94.5% |
| Immigrants | Indonesia | 12.3 /100 | #211 | Poor 94.5% |
| Immigrants | Malaysia | 12.2 /100 | #212 | Poor 94.5% |
| Immigrants | Oceania | 12.1 /100 | #213 | Poor 94.5% |
| Immigrants | Liberia | 11.8 /100 | #214 | Poor 94.5% |
| Immigrants | Syria | 11.0 /100 | #215 | Poor 94.5% |
| Immigrants | Western Asia | 10.7 /100 | #216 | Poor 94.5% |
| Asians | 9.9 /100 | #217 | Tragic 94.5% |
| Portuguese | 9.2 /100 | #218 | Tragic 94.5% |
| Africans | 9.0 /100 | #219 | Tragic 94.5% |
| Indians (Asian) | 8.6 /100 | #220 | Tragic 94.5% |
| Immigrants | Eastern Africa | 8.2 /100 | #221 | Tragic 94.5% |
| Immigrants | Asia | 7.7 /100 | #222 | Tragic 94.4% |
| Bahamians | 7.0 /100 | #223 | Tragic 94.4% |