Hawaiian vs Immigrants from Mexico College, Under 1 year
COMPARE
Hawaiian
Immigrants from Mexico
College, Under 1 year
College, Under 1 year Comparison
Hawaiians
Immigrants from Mexico
62.1%
COLLEGE, UNDER 1 YEAR
1.1/ 100
METRIC RATING
243rd/ 347
METRIC RANK
53.7%
COLLEGE, UNDER 1 YEAR
0.0/ 100
METRIC RATING
342nd/ 347
METRIC RANK
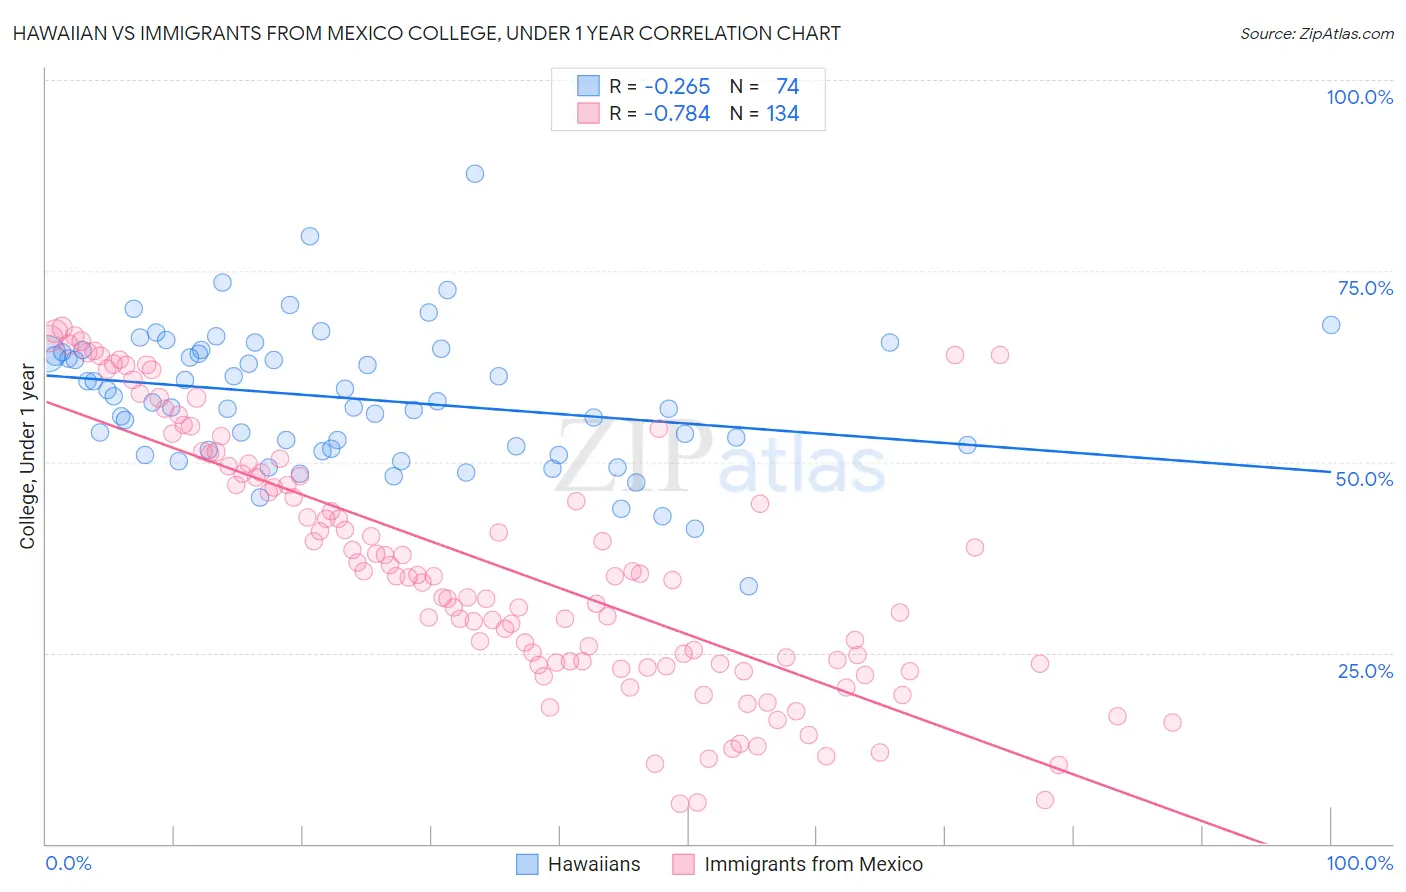
Hawaiian vs Immigrants from Mexico College, Under 1 year Correlation Chart
The statistical analysis conducted on geographies consisting of 327,620,447 people shows a weak negative correlation between the proportion of Hawaiians and percentage of population with at least college, under 1 year education in the United States with a correlation coefficient (R) of -0.265 and weighted average of 62.1%. Similarly, the statistical analysis conducted on geographies consisting of 513,757,474 people shows a strong negative correlation between the proportion of Immigrants from Mexico and percentage of population with at least college, under 1 year education in the United States with a correlation coefficient (R) of -0.784 and weighted average of 53.7%, a difference of 15.8%.
College, Under 1 year Correlation Summary
| Measurement | Hawaiian | Immigrants from Mexico |
| Minimum | 33.7% | 5.3% |
| Maximum | 87.7% | 67.5% |
| Range | 54.1% | 62.2% |
| Mean | 58.4% | 36.8% |
| Median | 57.8% | 35.1% |
| Interquartile 25% (IQ1) | 51.7% | 23.8% |
| Interquartile 75% (IQ3) | 64.3% | 49.4% |
| Interquartile Range (IQR) | 12.6% | 25.6% |
| Standard Deviation (Sample) | 9.0% | 16.6% |
| Standard Deviation (Population) | 9.0% | 16.5% |
Similar Demographics by College, Under 1 year
Demographics Similar to Hawaiians by College, Under 1 year
In terms of college, under 1 year, the demographic groups most similar to Hawaiians are Malaysian (62.2%, a difference of 0.030%), Ottawa (62.2%, a difference of 0.080%), Nepalese (62.2%, a difference of 0.090%), Aleut (62.2%, a difference of 0.090%), and Colville (62.1%, a difference of 0.090%).
| Demographics | Rating | Rank | College, Under 1 year |
| Immigrants | Immigrants | 1.7 /100 | #236 | Tragic 62.5% |
| Immigrants | Burma/Myanmar | 1.6 /100 | #237 | Tragic 62.5% |
| French American Indians | 1.5 /100 | #238 | Tragic 62.4% |
| Nepalese | 1.1 /100 | #239 | Tragic 62.2% |
| Aleuts | 1.1 /100 | #240 | Tragic 62.2% |
| Ottawa | 1.1 /100 | #241 | Tragic 62.2% |
| Malaysians | 1.1 /100 | #242 | Tragic 62.2% |
| Hawaiians | 1.1 /100 | #243 | Tragic 62.1% |
| Colville | 1.0 /100 | #244 | Tragic 62.1% |
| Delaware | 0.9 /100 | #245 | Tragic 62.1% |
| Marshallese | 0.8 /100 | #246 | Tragic 61.9% |
| Immigrants | Liberia | 0.8 /100 | #247 | Tragic 61.9% |
| Potawatomi | 0.6 /100 | #248 | Tragic 61.8% |
| Vietnamese | 0.5 /100 | #249 | Tragic 61.7% |
| Immigrants | Congo | 0.5 /100 | #250 | Tragic 61.7% |
Demographics Similar to Immigrants from Mexico by College, Under 1 year
In terms of college, under 1 year, the demographic groups most similar to Immigrants from Mexico are Immigrants from Cabo Verde (53.7%, a difference of 0.060%), Spanish American Indian (54.0%, a difference of 0.57%), Immigrants from Dominican Republic (54.0%, a difference of 0.65%), Lumbee (54.2%, a difference of 1.1%), and Immigrants from Central America (54.4%, a difference of 1.5%).
| Demographics | Rating | Rank | College, Under 1 year |
| Yuman | 0.0 /100 | #333 | Tragic 55.1% |
| Immigrants | Azores | 0.0 /100 | #334 | Tragic 54.7% |
| Inupiat | 0.0 /100 | #335 | Tragic 54.6% |
| Pennsylvania Germans | 0.0 /100 | #336 | Tragic 54.5% |
| Immigrants | Central America | 0.0 /100 | #337 | Tragic 54.4% |
| Lumbee | 0.0 /100 | #338 | Tragic 54.2% |
| Immigrants | Dominican Republic | 0.0 /100 | #339 | Tragic 54.0% |
| Spanish American Indians | 0.0 /100 | #340 | Tragic 54.0% |
| Immigrants | Cabo Verde | 0.0 /100 | #341 | Tragic 53.7% |
| Immigrants | Mexico | 0.0 /100 | #342 | Tragic 53.7% |
| Tohono O'odham | 0.0 /100 | #343 | Tragic 52.8% |
| Yakama | 0.0 /100 | #344 | Tragic 52.6% |
| Pima | 0.0 /100 | #345 | Tragic 51.4% |
| Houma | 0.0 /100 | #346 | Tragic 47.6% |
| Yup'ik | 0.0 /100 | #347 | Tragic 45.8% |