Immigrants from St. Vincent and the Grenadines vs Guatemalan Female Disability
COMPARE
Immigrants from St. Vincent and the Grenadines
Guatemalan
Female Disability
Female Disability Comparison
Immigrants from St. Vincent and the Grenadines
Guatemalans
12.2%
FEMALE DISABILITY
49.7/ 100
METRIC RATING
175th/ 347
METRIC RANK
12.1%
FEMALE DISABILITY
63.8/ 100
METRIC RATING
163rd/ 347
METRIC RANK
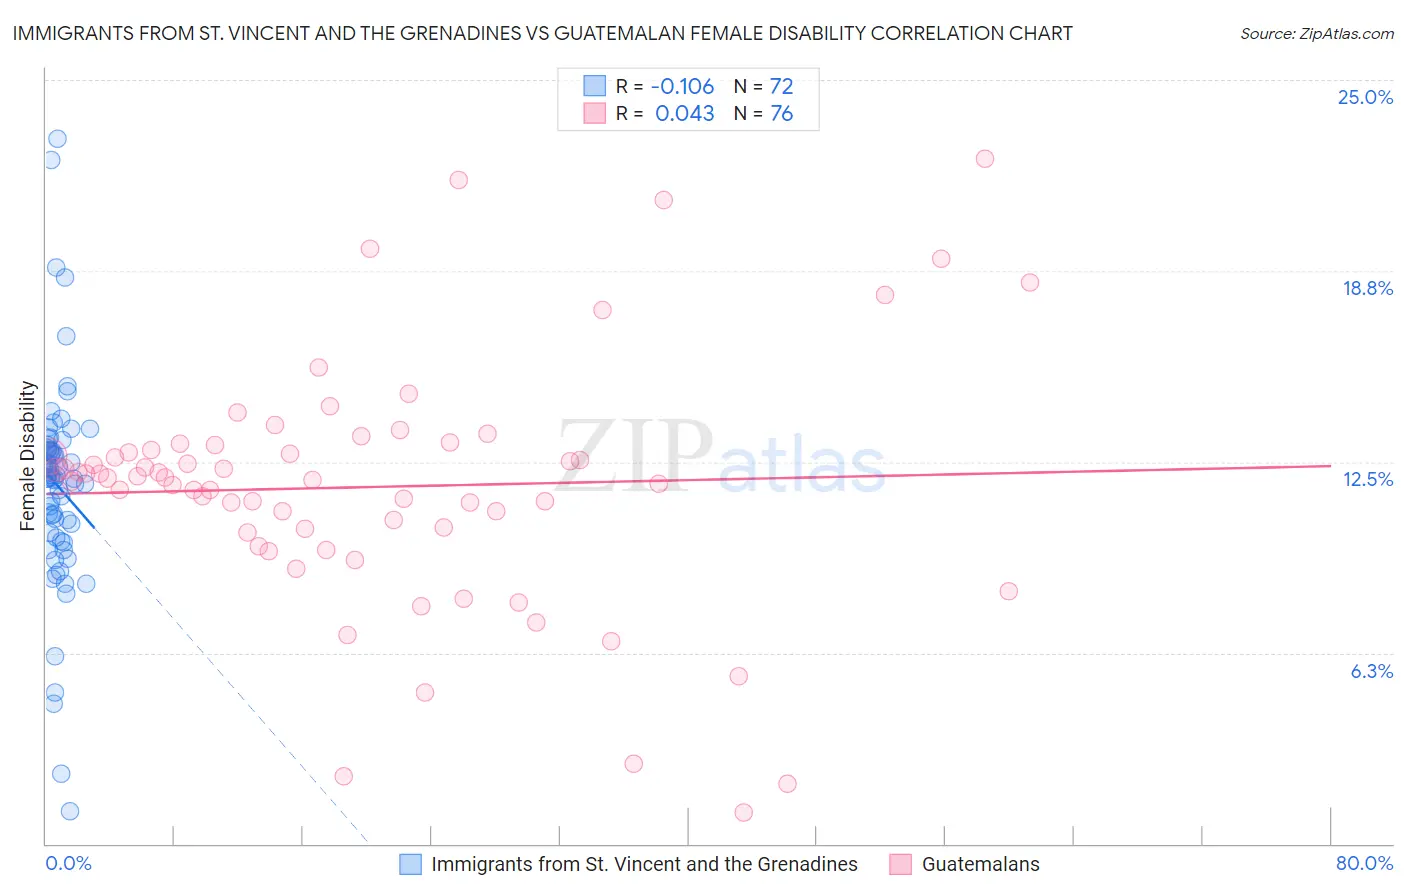
Immigrants from St. Vincent and the Grenadines vs Guatemalan Female Disability Correlation Chart
The statistical analysis conducted on geographies consisting of 56,175,072 people shows a poor negative correlation between the proportion of Immigrants from St. Vincent and the Grenadines and percentage of females with a disability in the United States with a correlation coefficient (R) of -0.106 and weighted average of 12.2%. Similarly, the statistical analysis conducted on geographies consisting of 409,476,424 people shows no correlation between the proportion of Guatemalans and percentage of females with a disability in the United States with a correlation coefficient (R) of 0.043 and weighted average of 12.1%, a difference of 0.55%.
Female Disability Correlation Summary
| Measurement | Immigrants from St. Vincent and the Grenadines | Guatemalan |
| Minimum | 1.1% | 1.0% |
| Maximum | 23.1% | 22.4% |
| Range | 22.0% | 21.4% |
| Mean | 11.7% | 11.7% |
| Median | 12.0% | 12.0% |
| Interquartile 25% (IQ1) | 10.1% | 10.2% |
| Interquartile 75% (IQ3) | 12.9% | 13.0% |
| Interquartile Range (IQR) | 2.8% | 2.7% |
| Standard Deviation (Sample) | 3.5% | 4.0% |
| Standard Deviation (Population) | 3.5% | 4.0% |
Demographics Similar to Immigrants from St. Vincent and the Grenadines and Guatemalans by Female Disability
In terms of female disability, the demographic groups most similar to Immigrants from St. Vincent and the Grenadines are Immigrants from England (12.2%, a difference of 0.010%), Immigrants from Mexico (12.2%, a difference of 0.040%), Haitian (12.2%, a difference of 0.080%), Immigrants from Southern Europe (12.2%, a difference of 0.25%), and Immigrants from Guyana (12.2%, a difference of 0.25%). Similarly, the demographic groups most similar to Guatemalans are Czech (12.1%, a difference of 0.010%), Immigrants from Ukraine (12.1%, a difference of 0.020%), Guyanese (12.1%, a difference of 0.030%), Immigrants from Oceania (12.1%, a difference of 0.080%), and Immigrants from Guatemala (12.1%, a difference of 0.090%).
| Demographics | Rating | Rank | Female Disability |
| Immigrants | Central America | 67.7 /100 | #159 | Good 12.1% |
| Immigrants | Guatemala | 66.0 /100 | #160 | Good 12.1% |
| Guyanese | 64.7 /100 | #161 | Good 12.1% |
| Immigrants | Ukraine | 64.3 /100 | #162 | Good 12.1% |
| Guatemalans | 63.8 /100 | #163 | Good 12.1% |
| Czechs | 63.6 /100 | #164 | Good 12.1% |
| Immigrants | Oceania | 61.8 /100 | #165 | Good 12.1% |
| Lithuanians | 59.5 /100 | #166 | Average 12.2% |
| Immigrants | Latin America | 59.0 /100 | #167 | Average 12.2% |
| Immigrants | Haiti | 58.8 /100 | #168 | Average 12.2% |
| Lebanese | 58.1 /100 | #169 | Average 12.2% |
| Maltese | 57.0 /100 | #170 | Average 12.2% |
| Immigrants | Southern Europe | 56.3 /100 | #171 | Average 12.2% |
| Haitians | 51.9 /100 | #172 | Average 12.2% |
| Immigrants | Mexico | 50.8 /100 | #173 | Average 12.2% |
| Immigrants | England | 50.0 /100 | #174 | Average 12.2% |
| Immigrants | St. Vincent and the Grenadines | 49.7 /100 | #175 | Average 12.2% |
| Immigrants | Guyana | 43.1 /100 | #176 | Average 12.2% |
| Immigrants | Ghana | 42.5 /100 | #177 | Average 12.2% |
| Immigrants | Western Europe | 40.9 /100 | #178 | Average 12.2% |
| Immigrants | Fiji | 38.2 /100 | #179 | Fair 12.3% |