Immigrants from Sri Lanka vs Austrian Master's Degree
COMPARE
Immigrants from Sri Lanka
Austrian
Master's Degree
Master's Degree Comparison
Immigrants from Sri Lanka
Austrians
19.9%
MASTER'S DEGREE
100.0/ 100
METRIC RATING
27th/ 347
METRIC RANK
16.7%
MASTER'S DEGREE
97.8/ 100
METRIC RATING
111th/ 347
METRIC RANK
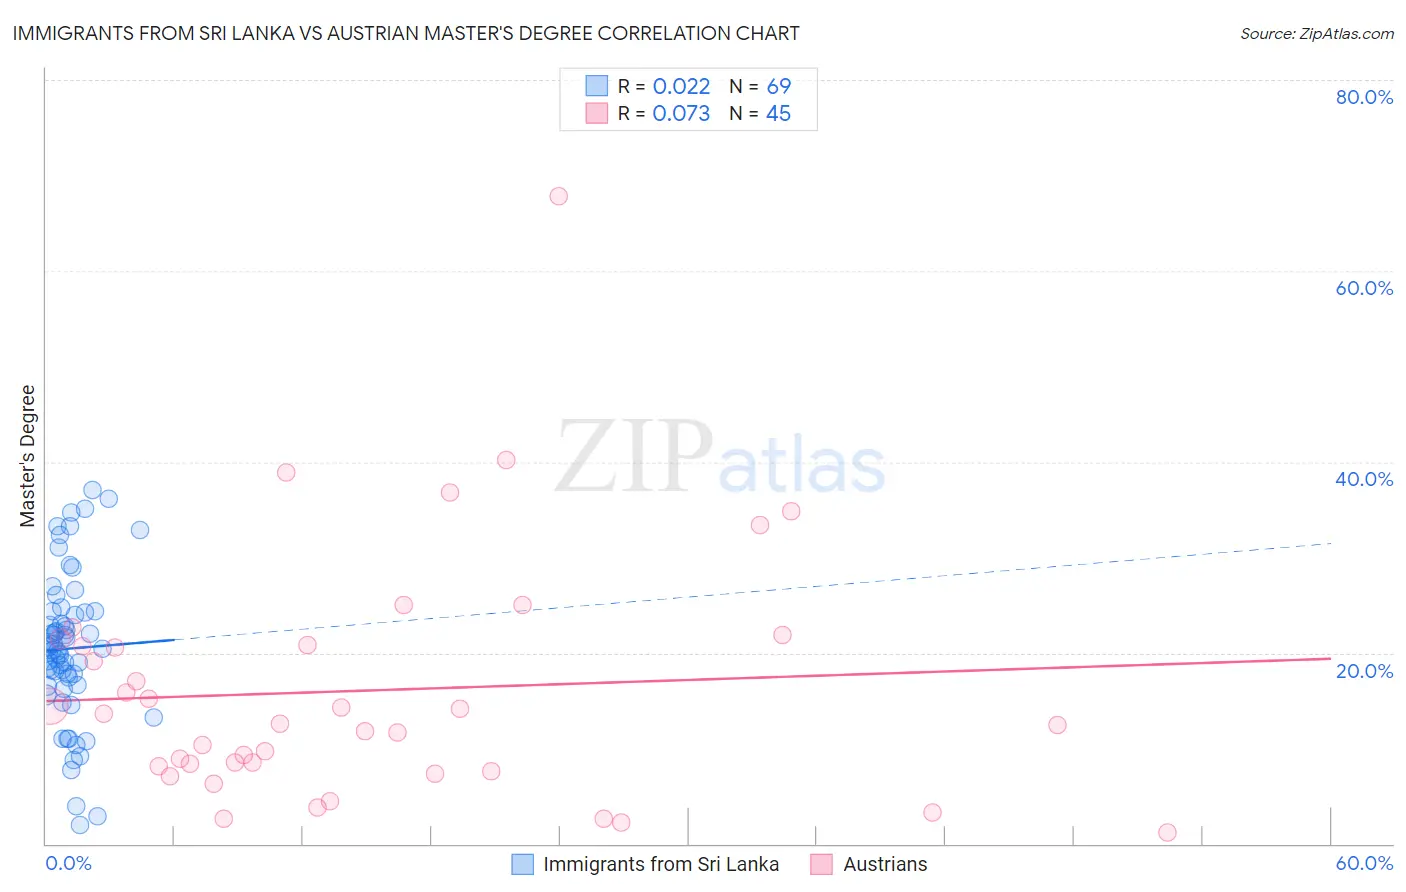
Immigrants from Sri Lanka vs Austrian Master's Degree Correlation Chart
The statistical analysis conducted on geographies consisting of 149,694,773 people shows no correlation between the proportion of Immigrants from Sri Lanka and percentage of population with at least master's degree education in the United States with a correlation coefficient (R) of 0.022 and weighted average of 19.9%. Similarly, the statistical analysis conducted on geographies consisting of 451,930,170 people shows a slight positive correlation between the proportion of Austrians and percentage of population with at least master's degree education in the United States with a correlation coefficient (R) of 0.073 and weighted average of 16.7%, a difference of 19.0%.
Master's Degree Correlation Summary
| Measurement | Immigrants from Sri Lanka | Austrian |
| Minimum | 2.0% | 1.2% |
| Maximum | 37.1% | 67.9% |
| Range | 35.1% | 66.7% |
| Mean | 20.4% | 16.1% |
| Median | 20.3% | 12.6% |
| Interquartile 25% (IQ1) | 16.5% | 7.9% |
| Interquartile 75% (IQ3) | 24.3% | 21.1% |
| Interquartile Range (IQR) | 7.7% | 13.2% |
| Standard Deviation (Sample) | 7.8% | 12.8% |
| Standard Deviation (Population) | 7.7% | 12.7% |
Similar Demographics by Master's Degree
Demographics Similar to Immigrants from Sri Lanka by Master's Degree
In terms of master's degree, the demographic groups most similar to Immigrants from Sri Lanka are Turkish (19.9%, a difference of 0.070%), Cambodian (20.0%, a difference of 0.41%), Latvian (19.8%, a difference of 0.48%), Immigrants from Japan (20.0%, a difference of 0.51%), and Immigrants from Turkey (19.7%, a difference of 0.99%).
| Demographics | Rating | Rank | Master's Degree |
| Indians (Asian) | 100.0 /100 | #20 | Exceptional 20.5% |
| Immigrants | Ireland | 100.0 /100 | #21 | Exceptional 20.4% |
| Israelis | 100.0 /100 | #22 | Exceptional 20.3% |
| Immigrants | France | 100.0 /100 | #23 | Exceptional 20.3% |
| Immigrants | Sweden | 100.0 /100 | #24 | Exceptional 20.3% |
| Immigrants | Japan | 100.0 /100 | #25 | Exceptional 20.0% |
| Cambodians | 100.0 /100 | #26 | Exceptional 20.0% |
| Immigrants | Sri Lanka | 100.0 /100 | #27 | Exceptional 19.9% |
| Turks | 100.0 /100 | #28 | Exceptional 19.9% |
| Latvians | 100.0 /100 | #29 | Exceptional 19.8% |
| Immigrants | Turkey | 100.0 /100 | #30 | Exceptional 19.7% |
| Immigrants | Korea | 100.0 /100 | #31 | Exceptional 19.7% |
| Burmese | 100.0 /100 | #32 | Exceptional 19.7% |
| Russians | 100.0 /100 | #33 | Exceptional 19.5% |
| Immigrants | Denmark | 100.0 /100 | #34 | Exceptional 19.5% |
Demographics Similar to Austrians by Master's Degree
In terms of master's degree, the demographic groups most similar to Austrians are Macedonian (16.7%, a difference of 0.14%), Arab (16.7%, a difference of 0.15%), Northern European (16.7%, a difference of 0.22%), Immigrants from Chile (16.8%, a difference of 0.27%), and Moroccan (16.8%, a difference of 0.30%).
| Demographics | Rating | Rank | Master's Degree |
| Ukrainians | 98.3 /100 | #104 | Exceptional 16.9% |
| Syrians | 98.3 /100 | #105 | Exceptional 16.8% |
| Immigrants | Albania | 98.1 /100 | #106 | Exceptional 16.8% |
| Armenians | 98.0 /100 | #107 | Exceptional 16.8% |
| Sierra Leoneans | 98.0 /100 | #108 | Exceptional 16.8% |
| Moroccans | 98.0 /100 | #109 | Exceptional 16.8% |
| Immigrants | Chile | 98.0 /100 | #110 | Exceptional 16.8% |
| Austrians | 97.8 /100 | #111 | Exceptional 16.7% |
| Macedonians | 97.7 /100 | #112 | Exceptional 16.7% |
| Arabs | 97.7 /100 | #113 | Exceptional 16.7% |
| Northern Europeans | 97.6 /100 | #114 | Exceptional 16.7% |
| Immigrants | Uganda | 97.3 /100 | #115 | Exceptional 16.6% |
| Immigrants | Southern Europe | 97.2 /100 | #116 | Exceptional 16.6% |
| Immigrants | Moldova | 97.2 /100 | #117 | Exceptional 16.6% |
| Brazilians | 96.8 /100 | #118 | Exceptional 16.5% |