Immigrants from Sri Lanka vs Iranian Master's Degree
COMPARE
Immigrants from Sri Lanka
Iranian
Master's Degree
Master's Degree Comparison
Immigrants from Sri Lanka
Iranians
19.9%
MASTER'S DEGREE
100.0/ 100
METRIC RATING
27th/ 347
METRIC RANK
22.3%
MASTER'S DEGREE
100.0/ 100
METRIC RATING
7th/ 347
METRIC RANK
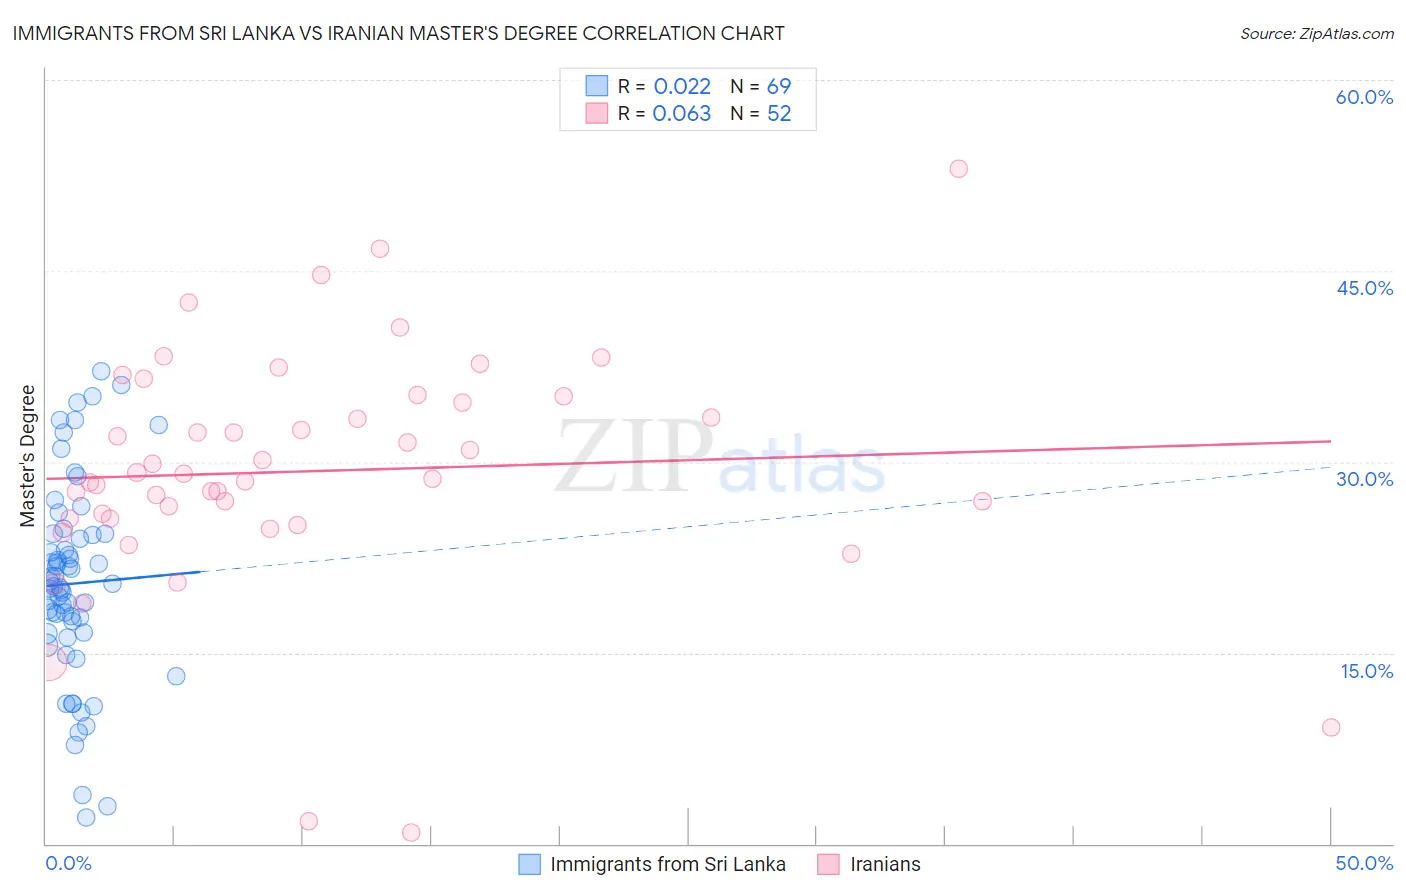
Immigrants from Sri Lanka vs Iranian Master's Degree Correlation Chart
The statistical analysis conducted on geographies consisting of 149,694,773 people shows no correlation between the proportion of Immigrants from Sri Lanka and percentage of population with at least master's degree education in the United States with a correlation coefficient (R) of 0.022 and weighted average of 19.9%. Similarly, the statistical analysis conducted on geographies consisting of 316,817,608 people shows a slight positive correlation between the proportion of Iranians and percentage of population with at least master's degree education in the United States with a correlation coefficient (R) of 0.063 and weighted average of 22.3%, a difference of 11.8%.
Master's Degree Correlation Summary
| Measurement | Immigrants from Sri Lanka | Iranian |
| Minimum | 2.0% | 0.89% |
| Maximum | 37.1% | 53.0% |
| Range | 35.1% | 52.1% |
| Mean | 20.4% | 29.3% |
| Median | 20.3% | 28.9% |
| Interquartile 25% (IQ1) | 16.5% | 25.5% |
| Interquartile 75% (IQ3) | 24.3% | 34.9% |
| Interquartile Range (IQR) | 7.7% | 9.4% |
| Standard Deviation (Sample) | 7.8% | 9.6% |
| Standard Deviation (Population) | 7.7% | 9.5% |
Demographics Similar to Immigrants from Sri Lanka and Iranians by Master's Degree
In terms of master's degree, the demographic groups most similar to Immigrants from Sri Lanka are Cambodian (20.0%, a difference of 0.41%), Immigrants from Japan (20.0%, a difference of 0.51%), Immigrants from Sweden (20.3%, a difference of 1.8%), Immigrants from France (20.3%, a difference of 1.9%), and Israeli (20.3%, a difference of 2.2%). Similarly, the demographic groups most similar to Iranians are Cypriot (21.8%, a difference of 2.2%), Thai (21.7%, a difference of 2.5%), Immigrants from Iran (21.6%, a difference of 3.0%), Immigrants from China (21.2%, a difference of 5.1%), and Eastern European (21.1%, a difference of 5.5%).
| Demographics | Rating | Rank | Master's Degree |
| Iranians | 100.0 /100 | #7 | Exceptional 22.3% |
| Cypriots | 100.0 /100 | #8 | Exceptional 21.8% |
| Thais | 100.0 /100 | #9 | Exceptional 21.7% |
| Immigrants | Iran | 100.0 /100 | #10 | Exceptional 21.6% |
| Immigrants | China | 100.0 /100 | #11 | Exceptional 21.2% |
| Eastern Europeans | 100.0 /100 | #12 | Exceptional 21.1% |
| Immigrants | Australia | 100.0 /100 | #13 | Exceptional 20.9% |
| Immigrants | Switzerland | 100.0 /100 | #14 | Exceptional 20.9% |
| Immigrants | Eastern Asia | 100.0 /100 | #15 | Exceptional 20.8% |
| Immigrants | Belgium | 100.0 /100 | #16 | Exceptional 20.8% |
| Immigrants | South Central Asia | 100.0 /100 | #17 | Exceptional 20.7% |
| Soviet Union | 100.0 /100 | #18 | Exceptional 20.5% |
| Immigrants | Hong Kong | 100.0 /100 | #19 | Exceptional 20.5% |
| Indians (Asian) | 100.0 /100 | #20 | Exceptional 20.5% |
| Immigrants | Ireland | 100.0 /100 | #21 | Exceptional 20.4% |
| Israelis | 100.0 /100 | #22 | Exceptional 20.3% |
| Immigrants | France | 100.0 /100 | #23 | Exceptional 20.3% |
| Immigrants | Sweden | 100.0 /100 | #24 | Exceptional 20.3% |
| Immigrants | Japan | 100.0 /100 | #25 | Exceptional 20.0% |
| Cambodians | 100.0 /100 | #26 | Exceptional 20.0% |
| Immigrants | Sri Lanka | 100.0 /100 | #27 | Exceptional 19.9% |