Immigrants from Sri Lanka vs Central American Master's Degree
COMPARE
Immigrants from Sri Lanka
Central American
Master's Degree
Master's Degree Comparison
Immigrants from Sri Lanka
Central Americans
19.9%
MASTER'S DEGREE
100.0/ 100
METRIC RATING
27th/ 347
METRIC RANK
12.2%
MASTER'S DEGREE
0.3/ 100
METRIC RATING
269th/ 347
METRIC RANK
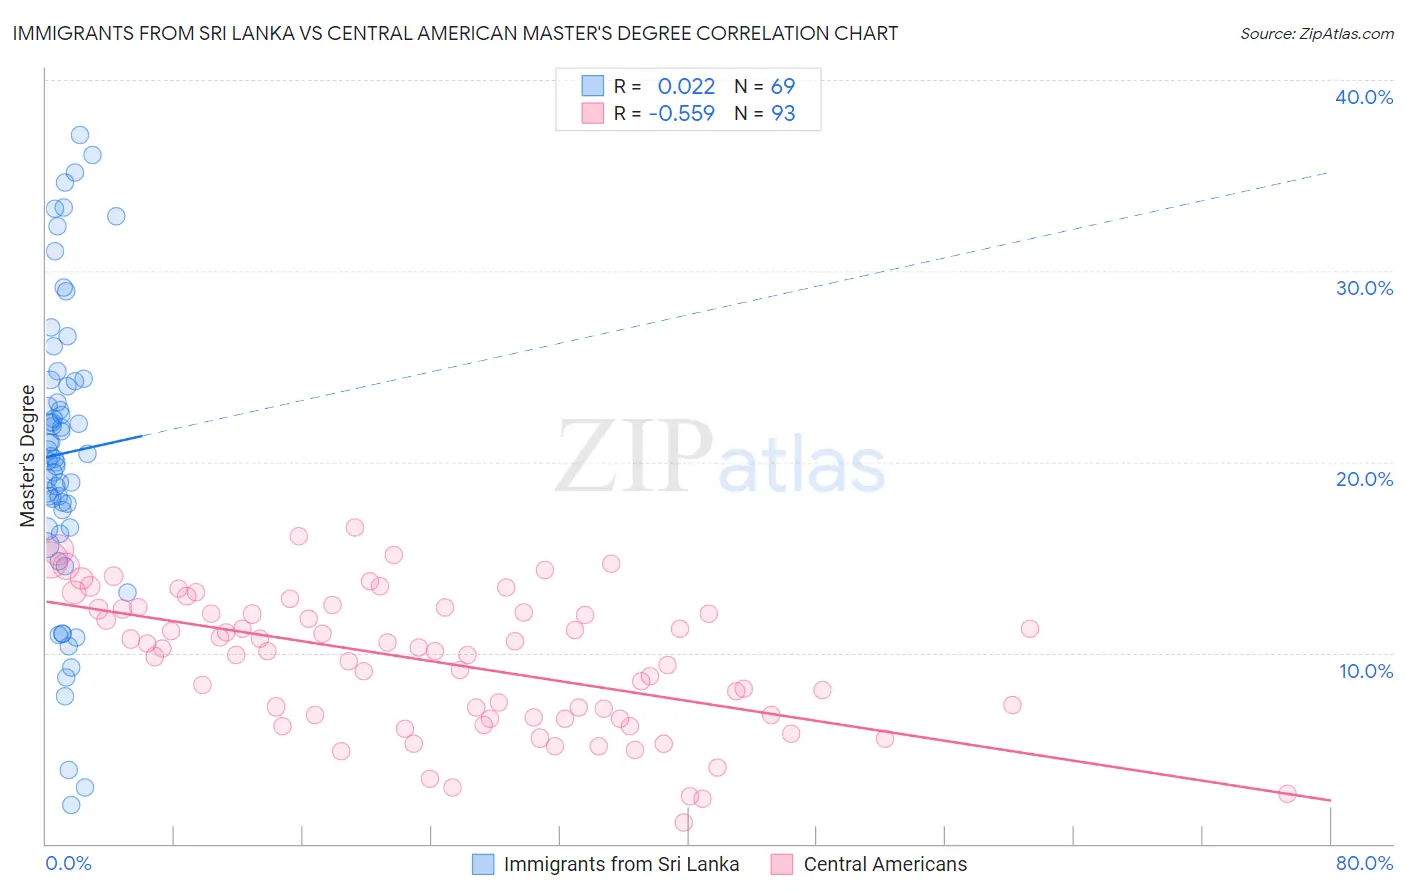
Immigrants from Sri Lanka vs Central American Master's Degree Correlation Chart
The statistical analysis conducted on geographies consisting of 149,694,773 people shows no correlation between the proportion of Immigrants from Sri Lanka and percentage of population with at least master's degree education in the United States with a correlation coefficient (R) of 0.022 and weighted average of 19.9%. Similarly, the statistical analysis conducted on geographies consisting of 504,206,003 people shows a substantial negative correlation between the proportion of Central Americans and percentage of population with at least master's degree education in the United States with a correlation coefficient (R) of -0.559 and weighted average of 12.2%, a difference of 63.3%.
Master's Degree Correlation Summary
| Measurement | Immigrants from Sri Lanka | Central American |
| Minimum | 2.0% | 1.1% |
| Maximum | 37.1% | 16.6% |
| Range | 35.1% | 15.4% |
| Mean | 20.4% | 9.5% |
| Median | 20.3% | 10.1% |
| Interquartile 25% (IQ1) | 16.5% | 6.6% |
| Interquartile 75% (IQ3) | 24.3% | 12.3% |
| Interquartile Range (IQR) | 7.7% | 5.7% |
| Standard Deviation (Sample) | 7.8% | 3.6% |
| Standard Deviation (Population) | 7.7% | 3.6% |
Similar Demographics by Master's Degree
Demographics Similar to Immigrants from Sri Lanka by Master's Degree
In terms of master's degree, the demographic groups most similar to Immigrants from Sri Lanka are Turkish (19.9%, a difference of 0.070%), Cambodian (20.0%, a difference of 0.41%), Latvian (19.8%, a difference of 0.48%), Immigrants from Japan (20.0%, a difference of 0.51%), and Immigrants from Turkey (19.7%, a difference of 0.99%).
| Demographics | Rating | Rank | Master's Degree |
| Indians (Asian) | 100.0 /100 | #20 | Exceptional 20.5% |
| Immigrants | Ireland | 100.0 /100 | #21 | Exceptional 20.4% |
| Israelis | 100.0 /100 | #22 | Exceptional 20.3% |
| Immigrants | France | 100.0 /100 | #23 | Exceptional 20.3% |
| Immigrants | Sweden | 100.0 /100 | #24 | Exceptional 20.3% |
| Immigrants | Japan | 100.0 /100 | #25 | Exceptional 20.0% |
| Cambodians | 100.0 /100 | #26 | Exceptional 20.0% |
| Immigrants | Sri Lanka | 100.0 /100 | #27 | Exceptional 19.9% |
| Turks | 100.0 /100 | #28 | Exceptional 19.9% |
| Latvians | 100.0 /100 | #29 | Exceptional 19.8% |
| Immigrants | Turkey | 100.0 /100 | #30 | Exceptional 19.7% |
| Immigrants | Korea | 100.0 /100 | #31 | Exceptional 19.7% |
| Burmese | 100.0 /100 | #32 | Exceptional 19.7% |
| Russians | 100.0 /100 | #33 | Exceptional 19.5% |
| Immigrants | Denmark | 100.0 /100 | #34 | Exceptional 19.5% |
Demographics Similar to Central Americans by Master's Degree
In terms of master's degree, the demographic groups most similar to Central Americans are Salvadoran (12.2%, a difference of 0.13%), Native Hawaiian (12.3%, a difference of 0.65%), Haitian (12.1%, a difference of 0.72%), Comanche (12.1%, a difference of 0.78%), and Blackfeet (12.1%, a difference of 0.87%).
| Demographics | Rating | Rank | Master's Degree |
| Nicaraguans | 0.6 /100 | #262 | Tragic 12.5% |
| Central American Indians | 0.5 /100 | #263 | Tragic 12.4% |
| Belizeans | 0.5 /100 | #264 | Tragic 12.4% |
| Immigrants | Fiji | 0.5 /100 | #265 | Tragic 12.4% |
| Bahamians | 0.5 /100 | #266 | Tragic 12.4% |
| Americans | 0.4 /100 | #267 | Tragic 12.3% |
| Native Hawaiians | 0.4 /100 | #268 | Tragic 12.3% |
| Central Americans | 0.3 /100 | #269 | Tragic 12.2% |
| Salvadorans | 0.3 /100 | #270 | Tragic 12.2% |
| Haitians | 0.3 /100 | #271 | Tragic 12.1% |
| Comanche | 0.3 /100 | #272 | Tragic 12.1% |
| Blackfeet | 0.3 /100 | #273 | Tragic 12.1% |
| Cape Verdeans | 0.3 /100 | #274 | Tragic 12.1% |
| Cubans | 0.3 /100 | #275 | Tragic 12.1% |
| Blacks/African Americans | 0.3 /100 | #276 | Tragic 12.1% |