Immigrants from Spain vs Immigrants from South Eastern Asia 2nd Grade
COMPARE
Immigrants from Spain
Immigrants from South Eastern Asia
2nd Grade
2nd Grade Comparison
Immigrants from Spain
Immigrants from South Eastern Asia
97.9%
2ND GRADE
55.4/ 100
METRIC RATING
169th/ 347
METRIC RANK
97.0%
2ND GRADE
0.0/ 100
METRIC RATING
300th/ 347
METRIC RANK
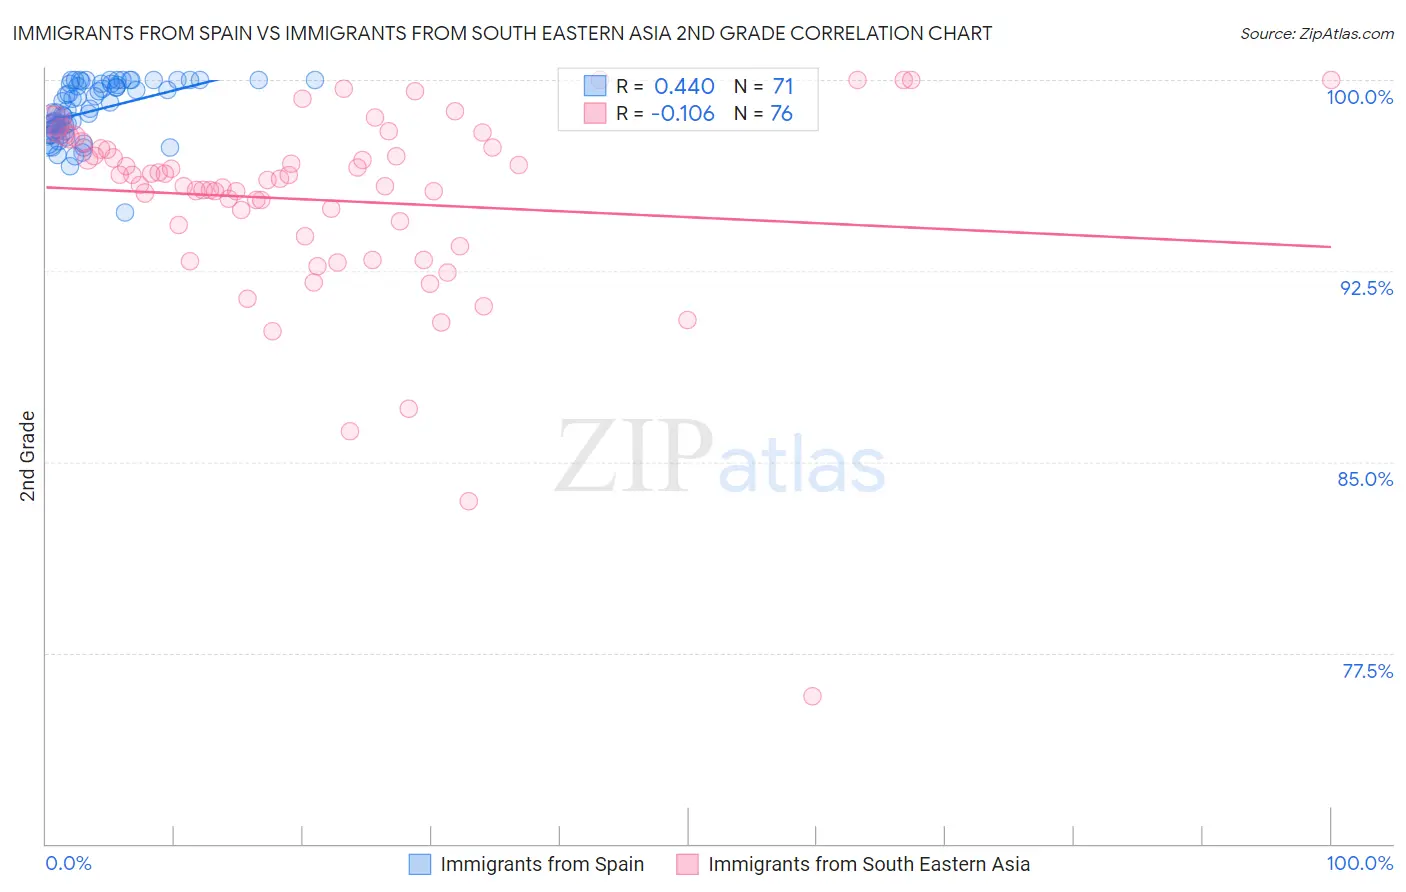
Immigrants from Spain vs Immigrants from South Eastern Asia 2nd Grade Correlation Chart
The statistical analysis conducted on geographies consisting of 239,682,160 people shows a moderate positive correlation between the proportion of Immigrants from Spain and percentage of population with at least 2nd grade education in the United States with a correlation coefficient (R) of 0.440 and weighted average of 97.9%. Similarly, the statistical analysis conducted on geographies consisting of 512,710,277 people shows a poor negative correlation between the proportion of Immigrants from South Eastern Asia and percentage of population with at least 2nd grade education in the United States with a correlation coefficient (R) of -0.106 and weighted average of 97.0%, a difference of 0.92%.
2nd Grade Correlation Summary
| Measurement | Immigrants from Spain | Immigrants from South Eastern Asia |
| Minimum | 94.8% | 75.8% |
| Maximum | 100.0% | 100.0% |
| Range | 5.2% | 24.2% |
| Mean | 98.8% | 95.3% |
| Median | 98.8% | 96.1% |
| Interquartile 25% (IQ1) | 98.0% | 94.1% |
| Interquartile 75% (IQ3) | 99.8% | 97.3% |
| Interquartile Range (IQR) | 1.9% | 3.2% |
| Standard Deviation (Sample) | 1.1% | 3.9% |
| Standard Deviation (Population) | 1.1% | 3.9% |
Similar Demographics by 2nd Grade
Demographics Similar to Immigrants from Spain by 2nd Grade
In terms of 2nd grade, the demographic groups most similar to Immigrants from Spain are Ugandan (97.9%, a difference of 0.0%), Spanish American (97.9%, a difference of 0.0%), Immigrants from Jordan (97.9%, a difference of 0.0%), Chilean (97.9%, a difference of 0.0%), and Brazilian (97.9%, a difference of 0.0%).
| Demographics | Rating | Rank | 2nd Grade |
| Immigrants | Italy | 60.2 /100 | #162 | Good 97.9% |
| Bermudans | 59.4 /100 | #163 | Average 97.9% |
| Ugandans | 56.6 /100 | #164 | Average 97.9% |
| Spanish Americans | 56.4 /100 | #165 | Average 97.9% |
| Immigrants | Jordan | 56.3 /100 | #166 | Average 97.9% |
| Chileans | 56.1 /100 | #167 | Average 97.9% |
| Brazilians | 55.8 /100 | #168 | Average 97.9% |
| Immigrants | Spain | 55.4 /100 | #169 | Average 97.9% |
| Navajo | 54.3 /100 | #170 | Average 97.9% |
| Albanians | 52.8 /100 | #171 | Average 97.9% |
| Immigrants | Korea | 52.7 /100 | #172 | Average 97.9% |
| Kenyans | 52.7 /100 | #173 | Average 97.9% |
| Immigrants | Micronesia | 50.0 /100 | #174 | Average 97.9% |
| Immigrants | Bosnia and Herzegovina | 49.8 /100 | #175 | Average 97.9% |
| Immigrants | Sri Lanka | 48.7 /100 | #176 | Average 97.9% |
Demographics Similar to Immigrants from South Eastern Asia by 2nd Grade
In terms of 2nd grade, the demographic groups most similar to Immigrants from South Eastern Asia are Immigrants from Cuba (97.0%, a difference of 0.020%), Immigrants from Dominica (97.0%, a difference of 0.020%), Haitian (97.0%, a difference of 0.020%), Central American Indian (97.0%, a difference of 0.020%), and Somali (97.0%, a difference of 0.040%).
| Demographics | Rating | Rank | 2nd Grade |
| British West Indians | 0.0 /100 | #293 | Tragic 97.2% |
| Malaysians | 0.0 /100 | #294 | Tragic 97.1% |
| Immigrants | Grenada | 0.0 /100 | #295 | Tragic 97.1% |
| Immigrants | Immigrants | 0.0 /100 | #296 | Tragic 97.1% |
| Immigrants | Cuba | 0.0 /100 | #297 | Tragic 97.0% |
| Immigrants | Dominica | 0.0 /100 | #298 | Tragic 97.0% |
| Haitians | 0.0 /100 | #299 | Tragic 97.0% |
| Immigrants | South Eastern Asia | 0.0 /100 | #300 | Tragic 97.0% |
| Central American Indians | 0.0 /100 | #301 | Tragic 97.0% |
| Somalis | 0.0 /100 | #302 | Tragic 97.0% |
| Ecuadorians | 0.0 /100 | #303 | Tragic 96.9% |
| Immigrants | Caribbean | 0.0 /100 | #304 | Tragic 96.9% |
| Nicaraguans | 0.0 /100 | #305 | Tragic 96.9% |
| Immigrants | Somalia | 0.0 /100 | #306 | Tragic 96.9% |
| Immigrants | Azores | 0.0 /100 | #307 | Tragic 96.8% |