Czech vs Immigrants from South Eastern Asia 2nd Grade
COMPARE
Czech
Immigrants from South Eastern Asia
2nd Grade
2nd Grade Comparison
Czechs
Immigrants from South Eastern Asia
98.5%
2ND GRADE
100.0/ 100
METRIC RATING
31st/ 347
METRIC RANK
97.0%
2ND GRADE
0.0/ 100
METRIC RATING
300th/ 347
METRIC RANK
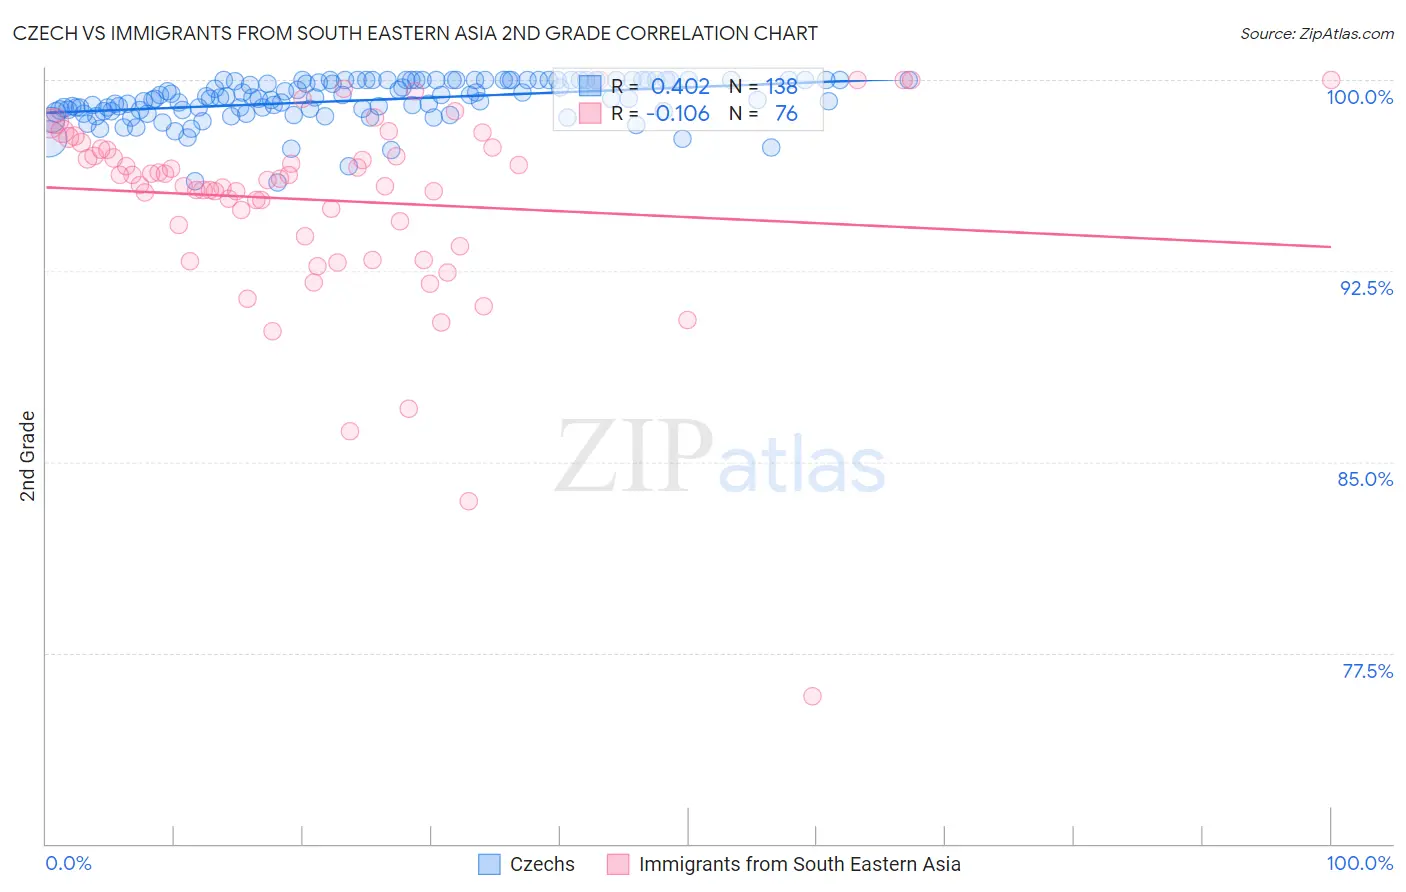
Czech vs Immigrants from South Eastern Asia 2nd Grade Correlation Chart
The statistical analysis conducted on geographies consisting of 484,813,102 people shows a moderate positive correlation between the proportion of Czechs and percentage of population with at least 2nd grade education in the United States with a correlation coefficient (R) of 0.402 and weighted average of 98.5%. Similarly, the statistical analysis conducted on geographies consisting of 512,710,277 people shows a poor negative correlation between the proportion of Immigrants from South Eastern Asia and percentage of population with at least 2nd grade education in the United States with a correlation coefficient (R) of -0.106 and weighted average of 97.0%, a difference of 1.6%.
2nd Grade Correlation Summary
| Measurement | Czech | Immigrants from South Eastern Asia |
| Minimum | 96.0% | 75.8% |
| Maximum | 100.0% | 100.0% |
| Range | 4.0% | 24.2% |
| Mean | 99.2% | 95.3% |
| Median | 99.3% | 96.1% |
| Interquartile 25% (IQ1) | 98.8% | 94.1% |
| Interquartile 75% (IQ3) | 100.0% | 97.3% |
| Interquartile Range (IQR) | 1.2% | 3.2% |
| Standard Deviation (Sample) | 0.82% | 3.9% |
| Standard Deviation (Population) | 0.82% | 3.9% |
Similar Demographics by 2nd Grade
Demographics Similar to Czechs by 2nd Grade
In terms of 2nd grade, the demographic groups most similar to Czechs are European (98.5%, a difference of 0.0%), French Canadian (98.5%, a difference of 0.0%), Arapaho (98.5%, a difference of 0.010%), French (98.5%, a difference of 0.010%), and Scandinavian (98.5%, a difference of 0.010%).
| Demographics | Rating | Rank | 2nd Grade |
| Pennsylvania Germans | 100.0 /100 | #24 | Exceptional 98.5% |
| Scotch-Irish | 100.0 /100 | #25 | Exceptional 98.5% |
| Welsh | 100.0 /100 | #26 | Exceptional 98.5% |
| Croatians | 100.0 /100 | #27 | Exceptional 98.5% |
| Arapaho | 100.0 /100 | #28 | Exceptional 98.5% |
| French | 100.0 /100 | #29 | Exceptional 98.5% |
| Europeans | 100.0 /100 | #30 | Exceptional 98.5% |
| Czechs | 100.0 /100 | #31 | Exceptional 98.5% |
| French Canadians | 100.0 /100 | #32 | Exceptional 98.5% |
| Scandinavians | 100.0 /100 | #33 | Exceptional 98.5% |
| Chinese | 100.0 /100 | #34 | Exceptional 98.5% |
| Swiss | 100.0 /100 | #35 | Exceptional 98.5% |
| British | 100.0 /100 | #36 | Exceptional 98.5% |
| Italians | 99.9 /100 | #37 | Exceptional 98.4% |
| Latvians | 99.9 /100 | #38 | Exceptional 98.4% |
Demographics Similar to Immigrants from South Eastern Asia by 2nd Grade
In terms of 2nd grade, the demographic groups most similar to Immigrants from South Eastern Asia are Immigrants from Cuba (97.0%, a difference of 0.020%), Immigrants from Dominica (97.0%, a difference of 0.020%), Haitian (97.0%, a difference of 0.020%), Central American Indian (97.0%, a difference of 0.020%), and Somali (97.0%, a difference of 0.040%).
| Demographics | Rating | Rank | 2nd Grade |
| British West Indians | 0.0 /100 | #293 | Tragic 97.2% |
| Malaysians | 0.0 /100 | #294 | Tragic 97.1% |
| Immigrants | Grenada | 0.0 /100 | #295 | Tragic 97.1% |
| Immigrants | Immigrants | 0.0 /100 | #296 | Tragic 97.1% |
| Immigrants | Cuba | 0.0 /100 | #297 | Tragic 97.0% |
| Immigrants | Dominica | 0.0 /100 | #298 | Tragic 97.0% |
| Haitians | 0.0 /100 | #299 | Tragic 97.0% |
| Immigrants | South Eastern Asia | 0.0 /100 | #300 | Tragic 97.0% |
| Central American Indians | 0.0 /100 | #301 | Tragic 97.0% |
| Somalis | 0.0 /100 | #302 | Tragic 97.0% |
| Ecuadorians | 0.0 /100 | #303 | Tragic 96.9% |
| Immigrants | Caribbean | 0.0 /100 | #304 | Tragic 96.9% |
| Nicaraguans | 0.0 /100 | #305 | Tragic 96.9% |
| Immigrants | Somalia | 0.0 /100 | #306 | Tragic 96.9% |
| Immigrants | Azores | 0.0 /100 | #307 | Tragic 96.8% |