Immigrants from Spain vs Slovak 2nd Grade
COMPARE
Immigrants from Spain
Slovak
2nd Grade
2nd Grade Comparison
Immigrants from Spain
Slovaks
97.9%
2ND GRADE
55.4/ 100
METRIC RATING
169th/ 347
METRIC RANK
98.7%
2ND GRADE
100.0/ 100
METRIC RATING
9th/ 347
METRIC RANK
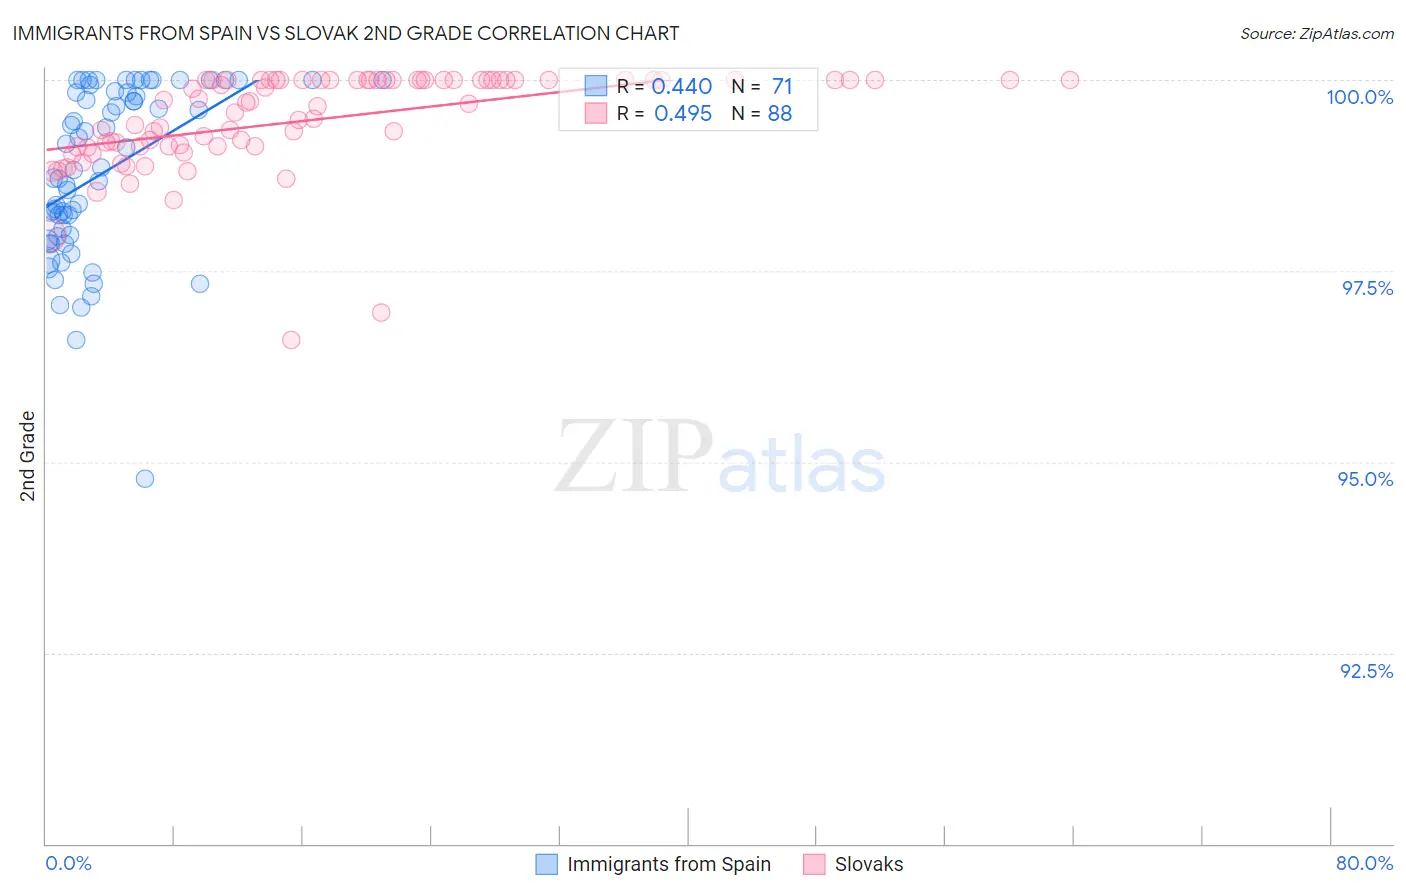
Immigrants from Spain vs Slovak 2nd Grade Correlation Chart
The statistical analysis conducted on geographies consisting of 239,682,160 people shows a moderate positive correlation between the proportion of Immigrants from Spain and percentage of population with at least 2nd grade education in the United States with a correlation coefficient (R) of 0.440 and weighted average of 97.9%. Similarly, the statistical analysis conducted on geographies consisting of 397,890,986 people shows a moderate positive correlation between the proportion of Slovaks and percentage of population with at least 2nd grade education in the United States with a correlation coefficient (R) of 0.495 and weighted average of 98.7%, a difference of 0.79%.
2nd Grade Correlation Summary
| Measurement | Immigrants from Spain | Slovak |
| Minimum | 94.8% | 96.6% |
| Maximum | 100.0% | 100.0% |
| Range | 5.2% | 3.4% |
| Mean | 98.8% | 99.5% |
| Median | 98.8% | 99.7% |
| Interquartile 25% (IQ1) | 98.0% | 99.1% |
| Interquartile 75% (IQ3) | 99.8% | 100.0% |
| Interquartile Range (IQR) | 1.9% | 0.87% |
| Standard Deviation (Sample) | 1.1% | 0.65% |
| Standard Deviation (Population) | 1.1% | 0.65% |
Similar Demographics by 2nd Grade
Demographics Similar to Immigrants from Spain by 2nd Grade
In terms of 2nd grade, the demographic groups most similar to Immigrants from Spain are Ugandan (97.9%, a difference of 0.0%), Spanish American (97.9%, a difference of 0.0%), Immigrants from Jordan (97.9%, a difference of 0.0%), Chilean (97.9%, a difference of 0.0%), and Brazilian (97.9%, a difference of 0.0%).
| Demographics | Rating | Rank | 2nd Grade |
| Immigrants | Italy | 60.2 /100 | #162 | Good 97.9% |
| Bermudans | 59.4 /100 | #163 | Average 97.9% |
| Ugandans | 56.6 /100 | #164 | Average 97.9% |
| Spanish Americans | 56.4 /100 | #165 | Average 97.9% |
| Immigrants | Jordan | 56.3 /100 | #166 | Average 97.9% |
| Chileans | 56.1 /100 | #167 | Average 97.9% |
| Brazilians | 55.8 /100 | #168 | Average 97.9% |
| Immigrants | Spain | 55.4 /100 | #169 | Average 97.9% |
| Navajo | 54.3 /100 | #170 | Average 97.9% |
| Albanians | 52.8 /100 | #171 | Average 97.9% |
| Immigrants | Korea | 52.7 /100 | #172 | Average 97.9% |
| Kenyans | 52.7 /100 | #173 | Average 97.9% |
| Immigrants | Micronesia | 50.0 /100 | #174 | Average 97.9% |
| Immigrants | Bosnia and Herzegovina | 49.8 /100 | #175 | Average 97.9% |
| Immigrants | Sri Lanka | 48.7 /100 | #176 | Average 97.9% |
Demographics Similar to Slovaks by 2nd Grade
In terms of 2nd grade, the demographic groups most similar to Slovaks are German (98.7%, a difference of 0.0%), Norwegian (98.7%, a difference of 0.020%), Slovene (98.6%, a difference of 0.020%), Alaska Native (98.7%, a difference of 0.030%), and Tlingit-Haida (98.6%, a difference of 0.030%).
| Demographics | Rating | Rank | 2nd Grade |
| Yup'ik | 100.0 /100 | #2 | Exceptional 99.2% |
| Inupiat | 100.0 /100 | #3 | Exceptional 98.8% |
| Tsimshian | 100.0 /100 | #4 | Exceptional 98.8% |
| Alaskan Athabascans | 100.0 /100 | #5 | Exceptional 98.7% |
| Alaska Natives | 100.0 /100 | #6 | Exceptional 98.7% |
| Norwegians | 100.0 /100 | #7 | Exceptional 98.7% |
| Germans | 100.0 /100 | #8 | Exceptional 98.7% |
| Slovaks | 100.0 /100 | #9 | Exceptional 98.7% |
| Slovenes | 100.0 /100 | #10 | Exceptional 98.6% |
| Tlingit-Haida | 100.0 /100 | #11 | Exceptional 98.6% |
| Carpatho Rusyns | 100.0 /100 | #12 | Exceptional 98.6% |
| English | 100.0 /100 | #13 | Exceptional 98.6% |
| Swedes | 100.0 /100 | #14 | Exceptional 98.6% |
| Scottish | 100.0 /100 | #15 | Exceptional 98.6% |
| Dutch | 100.0 /100 | #16 | Exceptional 98.6% |