Ghanaian vs Immigrants from South Eastern Asia 2nd Grade
COMPARE
Ghanaian
Immigrants from South Eastern Asia
2nd Grade
2nd Grade Comparison
Ghanaians
Immigrants from South Eastern Asia
97.4%
2ND GRADE
0.1/ 100
METRIC RATING
274th/ 347
METRIC RANK
97.0%
2ND GRADE
0.0/ 100
METRIC RATING
300th/ 347
METRIC RANK
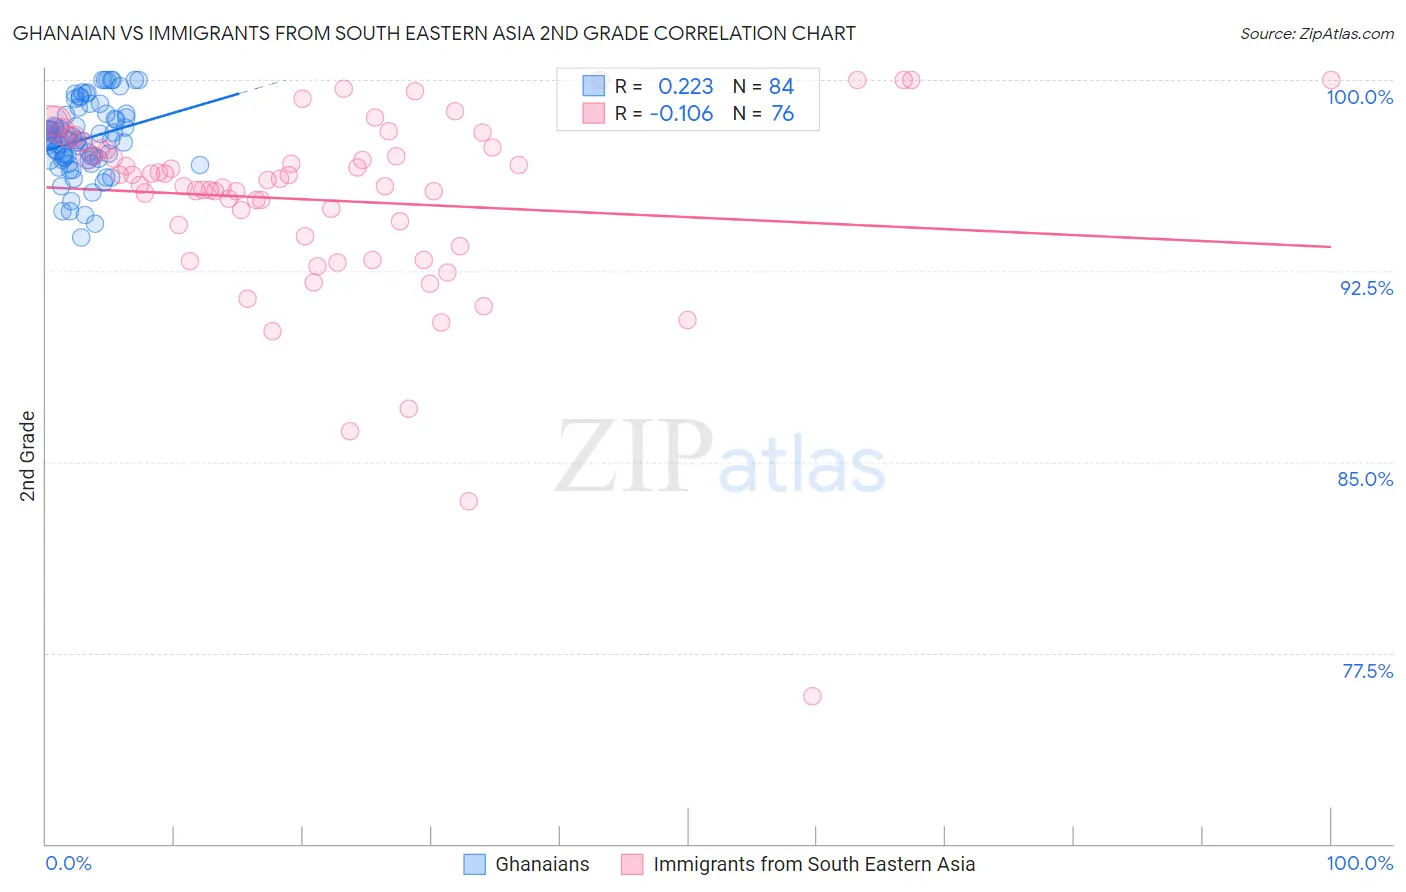
Ghanaian vs Immigrants from South Eastern Asia 2nd Grade Correlation Chart
The statistical analysis conducted on geographies consisting of 190,712,873 people shows a weak positive correlation between the proportion of Ghanaians and percentage of population with at least 2nd grade education in the United States with a correlation coefficient (R) of 0.223 and weighted average of 97.4%. Similarly, the statistical analysis conducted on geographies consisting of 512,710,277 people shows a poor negative correlation between the proportion of Immigrants from South Eastern Asia and percentage of population with at least 2nd grade education in the United States with a correlation coefficient (R) of -0.106 and weighted average of 97.0%, a difference of 0.37%.
2nd Grade Correlation Summary
| Measurement | Ghanaian | Immigrants from South Eastern Asia |
| Minimum | 93.8% | 75.8% |
| Maximum | 100.0% | 100.0% |
| Range | 6.2% | 24.2% |
| Mean | 97.7% | 95.3% |
| Median | 97.7% | 96.1% |
| Interquartile 25% (IQ1) | 96.9% | 94.1% |
| Interquartile 75% (IQ3) | 98.6% | 97.3% |
| Interquartile Range (IQR) | 1.7% | 3.2% |
| Standard Deviation (Sample) | 1.4% | 3.9% |
| Standard Deviation (Population) | 1.4% | 3.9% |
Similar Demographics by 2nd Grade
Demographics Similar to Ghanaians by 2nd Grade
In terms of 2nd grade, the demographic groups most similar to Ghanaians are Immigrants from China (97.3%, a difference of 0.0%), Immigrants from Bolivia (97.4%, a difference of 0.010%), Immigrants from Cameroon (97.4%, a difference of 0.020%), Immigrants from Peru (97.4%, a difference of 0.020%), and Immigrants from Philippines (97.3%, a difference of 0.030%).
| Demographics | Rating | Rank | 2nd Grade |
| Cubans | 0.3 /100 | #267 | Tragic 97.4% |
| Immigrants | Nigeria | 0.3 /100 | #268 | Tragic 97.4% |
| West Indians | 0.3 /100 | #269 | Tragic 97.4% |
| Immigrants | Jamaica | 0.2 /100 | #270 | Tragic 97.4% |
| Immigrants | Cameroon | 0.2 /100 | #271 | Tragic 97.4% |
| Immigrants | Peru | 0.1 /100 | #272 | Tragic 97.4% |
| Immigrants | Bolivia | 0.1 /100 | #273 | Tragic 97.4% |
| Ghanaians | 0.1 /100 | #274 | Tragic 97.4% |
| Immigrants | China | 0.1 /100 | #275 | Tragic 97.3% |
| Immigrants | Philippines | 0.1 /100 | #276 | Tragic 97.3% |
| Immigrants | Western Africa | 0.1 /100 | #277 | Tragic 97.3% |
| Immigrants | Uzbekistan | 0.1 /100 | #278 | Tragic 97.3% |
| Immigrants | Ghana | 0.1 /100 | #279 | Tragic 97.3% |
| Afghans | 0.1 /100 | #280 | Tragic 97.3% |
| Trinidadians and Tobagonians | 0.1 /100 | #281 | Tragic 97.3% |
Demographics Similar to Immigrants from South Eastern Asia by 2nd Grade
In terms of 2nd grade, the demographic groups most similar to Immigrants from South Eastern Asia are Immigrants from Cuba (97.0%, a difference of 0.020%), Immigrants from Dominica (97.0%, a difference of 0.020%), Haitian (97.0%, a difference of 0.020%), Central American Indian (97.0%, a difference of 0.020%), and Somali (97.0%, a difference of 0.040%).
| Demographics | Rating | Rank | 2nd Grade |
| British West Indians | 0.0 /100 | #293 | Tragic 97.2% |
| Malaysians | 0.0 /100 | #294 | Tragic 97.1% |
| Immigrants | Grenada | 0.0 /100 | #295 | Tragic 97.1% |
| Immigrants | Immigrants | 0.0 /100 | #296 | Tragic 97.1% |
| Immigrants | Cuba | 0.0 /100 | #297 | Tragic 97.0% |
| Immigrants | Dominica | 0.0 /100 | #298 | Tragic 97.0% |
| Haitians | 0.0 /100 | #299 | Tragic 97.0% |
| Immigrants | South Eastern Asia | 0.0 /100 | #300 | Tragic 97.0% |
| Central American Indians | 0.0 /100 | #301 | Tragic 97.0% |
| Somalis | 0.0 /100 | #302 | Tragic 97.0% |
| Ecuadorians | 0.0 /100 | #303 | Tragic 96.9% |
| Immigrants | Caribbean | 0.0 /100 | #304 | Tragic 96.9% |
| Nicaraguans | 0.0 /100 | #305 | Tragic 96.9% |
| Immigrants | Somalia | 0.0 /100 | #306 | Tragic 96.9% |
| Immigrants | Azores | 0.0 /100 | #307 | Tragic 96.8% |