Immigrants from Spain vs Chinese 2nd Grade
COMPARE
Immigrants from Spain
Chinese
2nd Grade
2nd Grade Comparison
Immigrants from Spain
Chinese
97.9%
2ND GRADE
55.4/ 100
METRIC RATING
169th/ 347
METRIC RANK
98.5%
2ND GRADE
100.0/ 100
METRIC RATING
34th/ 347
METRIC RANK
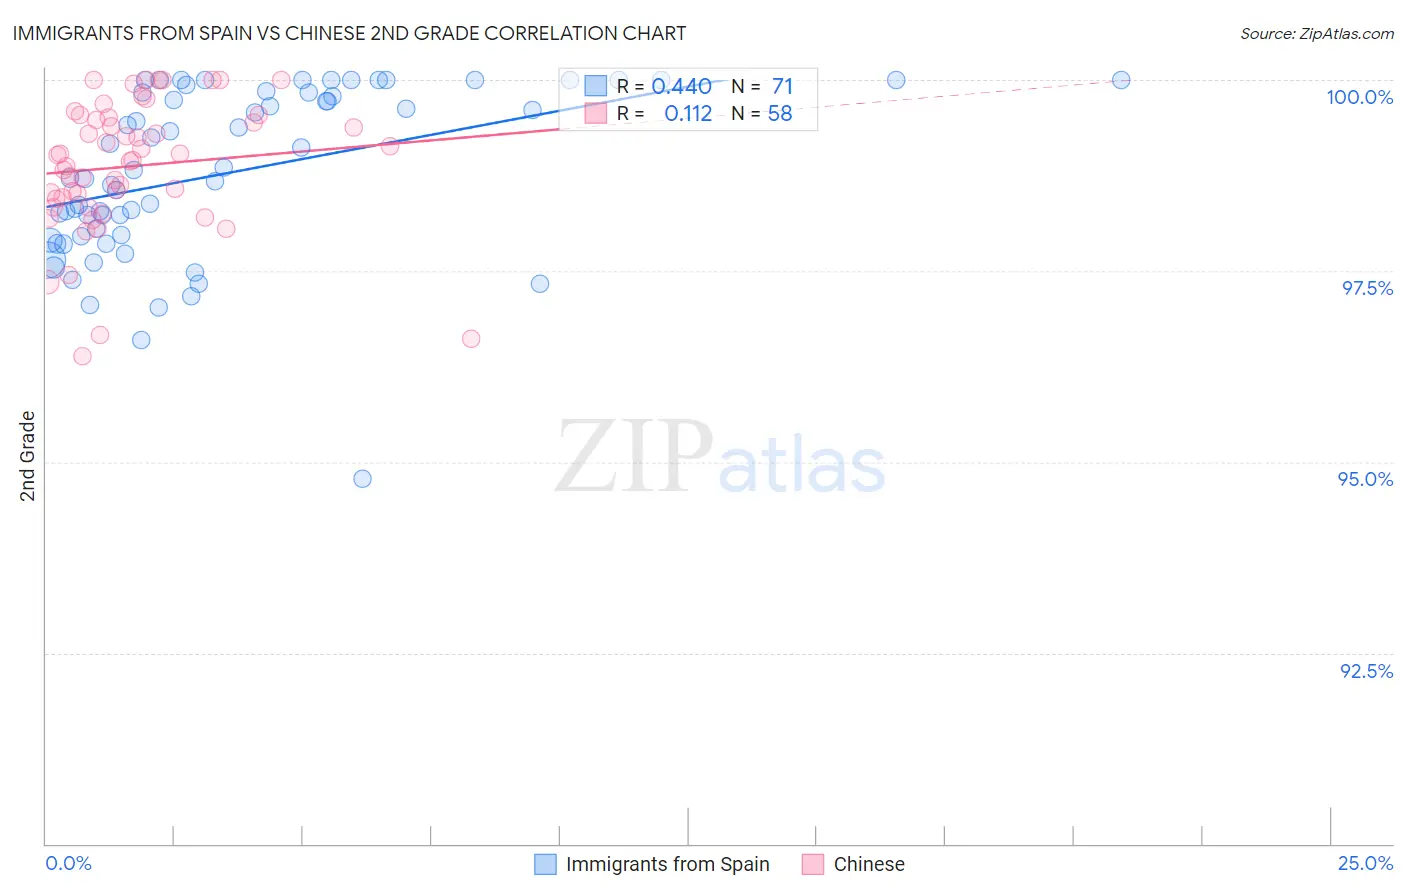
Immigrants from Spain vs Chinese 2nd Grade Correlation Chart
The statistical analysis conducted on geographies consisting of 239,682,160 people shows a moderate positive correlation between the proportion of Immigrants from Spain and percentage of population with at least 2nd grade education in the United States with a correlation coefficient (R) of 0.440 and weighted average of 97.9%. Similarly, the statistical analysis conducted on geographies consisting of 64,808,307 people shows a poor positive correlation between the proportion of Chinese and percentage of population with at least 2nd grade education in the United States with a correlation coefficient (R) of 0.112 and weighted average of 98.5%, a difference of 0.61%.
2nd Grade Correlation Summary
| Measurement | Immigrants from Spain | Chinese |
| Minimum | 94.8% | 96.4% |
| Maximum | 100.0% | 100.0% |
| Range | 5.2% | 3.6% |
| Mean | 98.8% | 98.9% |
| Median | 98.8% | 99.0% |
| Interquartile 25% (IQ1) | 98.0% | 98.4% |
| Interquartile 75% (IQ3) | 99.8% | 99.5% |
| Interquartile Range (IQR) | 1.9% | 1.1% |
| Standard Deviation (Sample) | 1.1% | 0.86% |
| Standard Deviation (Population) | 1.1% | 0.85% |
Similar Demographics by 2nd Grade
Demographics Similar to Immigrants from Spain by 2nd Grade
In terms of 2nd grade, the demographic groups most similar to Immigrants from Spain are Ugandan (97.9%, a difference of 0.0%), Spanish American (97.9%, a difference of 0.0%), Immigrants from Jordan (97.9%, a difference of 0.0%), Chilean (97.9%, a difference of 0.0%), and Brazilian (97.9%, a difference of 0.0%).
| Demographics | Rating | Rank | 2nd Grade |
| Immigrants | Italy | 60.2 /100 | #162 | Good 97.9% |
| Bermudans | 59.4 /100 | #163 | Average 97.9% |
| Ugandans | 56.6 /100 | #164 | Average 97.9% |
| Spanish Americans | 56.4 /100 | #165 | Average 97.9% |
| Immigrants | Jordan | 56.3 /100 | #166 | Average 97.9% |
| Chileans | 56.1 /100 | #167 | Average 97.9% |
| Brazilians | 55.8 /100 | #168 | Average 97.9% |
| Immigrants | Spain | 55.4 /100 | #169 | Average 97.9% |
| Navajo | 54.3 /100 | #170 | Average 97.9% |
| Albanians | 52.8 /100 | #171 | Average 97.9% |
| Immigrants | Korea | 52.7 /100 | #172 | Average 97.9% |
| Kenyans | 52.7 /100 | #173 | Average 97.9% |
| Immigrants | Micronesia | 50.0 /100 | #174 | Average 97.9% |
| Immigrants | Bosnia and Herzegovina | 49.8 /100 | #175 | Average 97.9% |
| Immigrants | Sri Lanka | 48.7 /100 | #176 | Average 97.9% |
Demographics Similar to Chinese by 2nd Grade
In terms of 2nd grade, the demographic groups most similar to Chinese are Swiss (98.5%, a difference of 0.010%), French Canadian (98.5%, a difference of 0.020%), Scandinavian (98.5%, a difference of 0.020%), British (98.5%, a difference of 0.020%), and European (98.5%, a difference of 0.030%).
| Demographics | Rating | Rank | 2nd Grade |
| Croatians | 100.0 /100 | #27 | Exceptional 98.5% |
| Arapaho | 100.0 /100 | #28 | Exceptional 98.5% |
| French | 100.0 /100 | #29 | Exceptional 98.5% |
| Europeans | 100.0 /100 | #30 | Exceptional 98.5% |
| Czechs | 100.0 /100 | #31 | Exceptional 98.5% |
| French Canadians | 100.0 /100 | #32 | Exceptional 98.5% |
| Scandinavians | 100.0 /100 | #33 | Exceptional 98.5% |
| Chinese | 100.0 /100 | #34 | Exceptional 98.5% |
| Swiss | 100.0 /100 | #35 | Exceptional 98.5% |
| British | 100.0 /100 | #36 | Exceptional 98.5% |
| Italians | 99.9 /100 | #37 | Exceptional 98.4% |
| Latvians | 99.9 /100 | #38 | Exceptional 98.4% |
| Chippewa | 99.9 /100 | #39 | Exceptional 98.4% |
| Luxembourgers | 99.9 /100 | #40 | Exceptional 98.4% |
| Eastern Europeans | 99.9 /100 | #41 | Exceptional 98.4% |