Immigrants from Spain vs Immigrants from Ecuador 2nd Grade
COMPARE
Immigrants from Spain
Immigrants from Ecuador
2nd Grade
2nd Grade Comparison
Immigrants from Spain
Immigrants from Ecuador
97.9%
2ND GRADE
55.4/ 100
METRIC RATING
169th/ 347
METRIC RANK
96.8%
2ND GRADE
0.0/ 100
METRIC RATING
314th/ 347
METRIC RANK
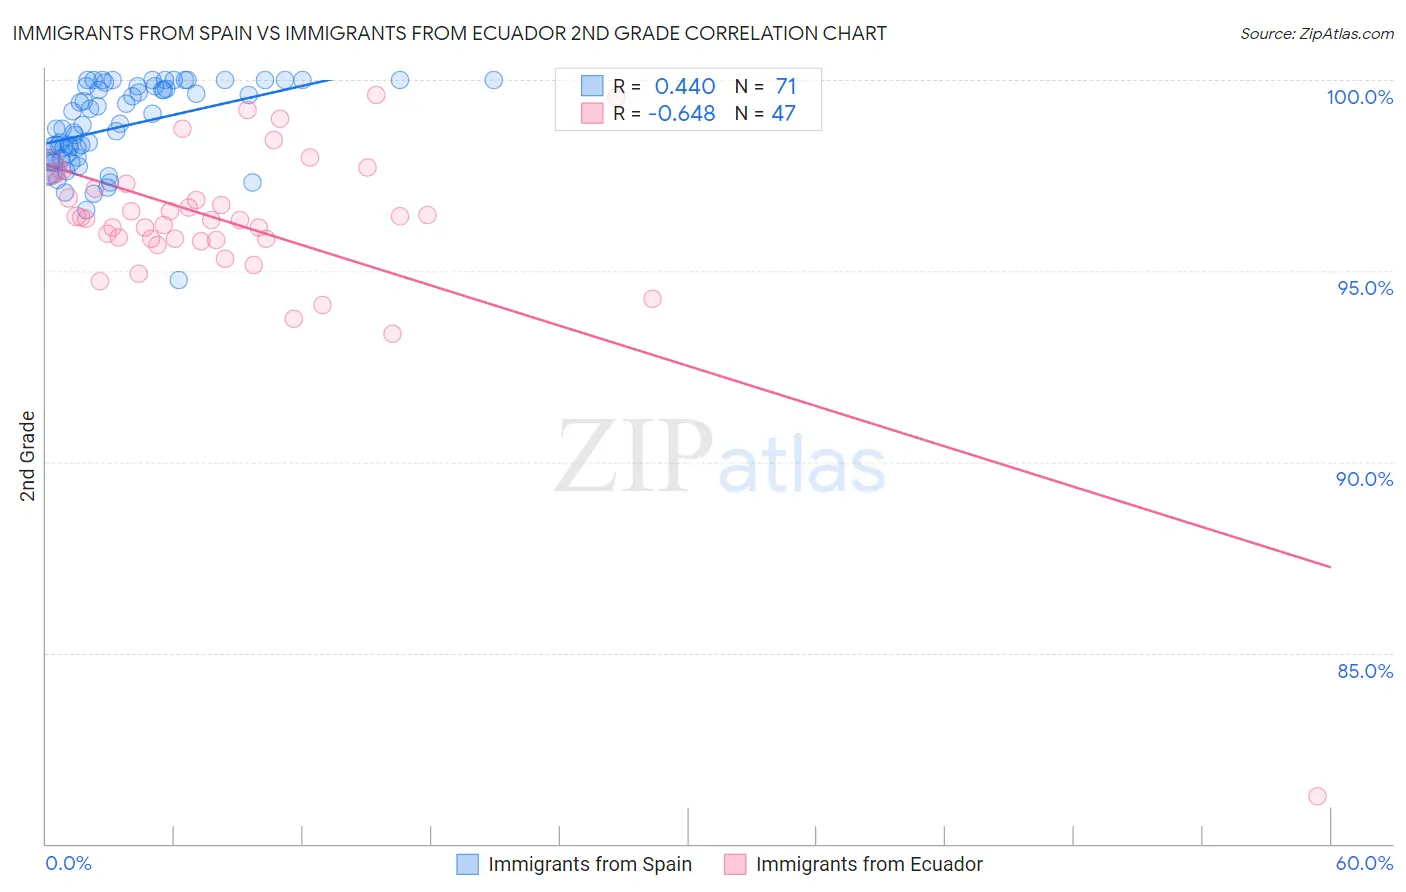
Immigrants from Spain vs Immigrants from Ecuador 2nd Grade Correlation Chart
The statistical analysis conducted on geographies consisting of 239,682,160 people shows a moderate positive correlation between the proportion of Immigrants from Spain and percentage of population with at least 2nd grade education in the United States with a correlation coefficient (R) of 0.440 and weighted average of 97.9%. Similarly, the statistical analysis conducted on geographies consisting of 271,020,679 people shows a significant negative correlation between the proportion of Immigrants from Ecuador and percentage of population with at least 2nd grade education in the United States with a correlation coefficient (R) of -0.648 and weighted average of 96.8%, a difference of 1.1%.
2nd Grade Correlation Summary
| Measurement | Immigrants from Spain | Immigrants from Ecuador |
| Minimum | 94.8% | 81.2% |
| Maximum | 100.0% | 99.6% |
| Range | 5.2% | 18.3% |
| Mean | 98.8% | 96.2% |
| Median | 98.8% | 96.4% |
| Interquartile 25% (IQ1) | 98.0% | 95.8% |
| Interquartile 75% (IQ3) | 99.8% | 97.3% |
| Interquartile Range (IQR) | 1.9% | 1.5% |
| Standard Deviation (Sample) | 1.1% | 2.6% |
| Standard Deviation (Population) | 1.1% | 2.6% |
Similar Demographics by 2nd Grade
Demographics Similar to Immigrants from Spain by 2nd Grade
In terms of 2nd grade, the demographic groups most similar to Immigrants from Spain are Ugandan (97.9%, a difference of 0.0%), Spanish American (97.9%, a difference of 0.0%), Immigrants from Jordan (97.9%, a difference of 0.0%), Chilean (97.9%, a difference of 0.0%), and Brazilian (97.9%, a difference of 0.0%).
| Demographics | Rating | Rank | 2nd Grade |
| Immigrants | Italy | 60.2 /100 | #162 | Good 97.9% |
| Bermudans | 59.4 /100 | #163 | Average 97.9% |
| Ugandans | 56.6 /100 | #164 | Average 97.9% |
| Spanish Americans | 56.4 /100 | #165 | Average 97.9% |
| Immigrants | Jordan | 56.3 /100 | #166 | Average 97.9% |
| Chileans | 56.1 /100 | #167 | Average 97.9% |
| Brazilians | 55.8 /100 | #168 | Average 97.9% |
| Immigrants | Spain | 55.4 /100 | #169 | Average 97.9% |
| Navajo | 54.3 /100 | #170 | Average 97.9% |
| Albanians | 52.8 /100 | #171 | Average 97.9% |
| Immigrants | Korea | 52.7 /100 | #172 | Average 97.9% |
| Kenyans | 52.7 /100 | #173 | Average 97.9% |
| Immigrants | Micronesia | 50.0 /100 | #174 | Average 97.9% |
| Immigrants | Bosnia and Herzegovina | 49.8 /100 | #175 | Average 97.9% |
| Immigrants | Sri Lanka | 48.7 /100 | #176 | Average 97.9% |
Demographics Similar to Immigrants from Ecuador by 2nd Grade
In terms of 2nd grade, the demographic groups most similar to Immigrants from Ecuador are Immigrants from Belize (96.8%, a difference of 0.020%), Hispanic or Latino (96.8%, a difference of 0.030%), Honduran (96.7%, a difference of 0.030%), Immigrants from Laos (96.7%, a difference of 0.030%), and Indonesian (96.7%, a difference of 0.030%).
| Demographics | Rating | Rank | 2nd Grade |
| Immigrants | Azores | 0.0 /100 | #307 | Tragic 96.8% |
| Immigrants | Haiti | 0.0 /100 | #308 | Tragic 96.8% |
| Belizeans | 0.0 /100 | #309 | Tragic 96.8% |
| Sri Lankans | 0.0 /100 | #310 | Tragic 96.8% |
| Guyanese | 0.0 /100 | #311 | Tragic 96.8% |
| Cape Verdeans | 0.0 /100 | #312 | Tragic 96.8% |
| Hispanics or Latinos | 0.0 /100 | #313 | Tragic 96.8% |
| Immigrants | Ecuador | 0.0 /100 | #314 | Tragic 96.8% |
| Immigrants | Belize | 0.0 /100 | #315 | Tragic 96.8% |
| Hondurans | 0.0 /100 | #316 | Tragic 96.7% |
| Immigrants | Laos | 0.0 /100 | #317 | Tragic 96.7% |
| Indonesians | 0.0 /100 | #318 | Tragic 96.7% |
| Immigrants | Nicaragua | 0.0 /100 | #319 | Tragic 96.7% |
| Immigrants | Guyana | 0.0 /100 | #320 | Tragic 96.7% |
| Immigrants | Burma/Myanmar | 0.0 /100 | #321 | Tragic 96.7% |