Immigrants from Spain vs Macedonian 2nd Grade
COMPARE
Immigrants from Spain
Macedonian
2nd Grade
2nd Grade Comparison
Immigrants from Spain
Macedonians
97.9%
2ND GRADE
55.4/ 100
METRIC RATING
169th/ 347
METRIC RANK
98.2%
2ND GRADE
99.0/ 100
METRIC RATING
88th/ 347
METRIC RANK
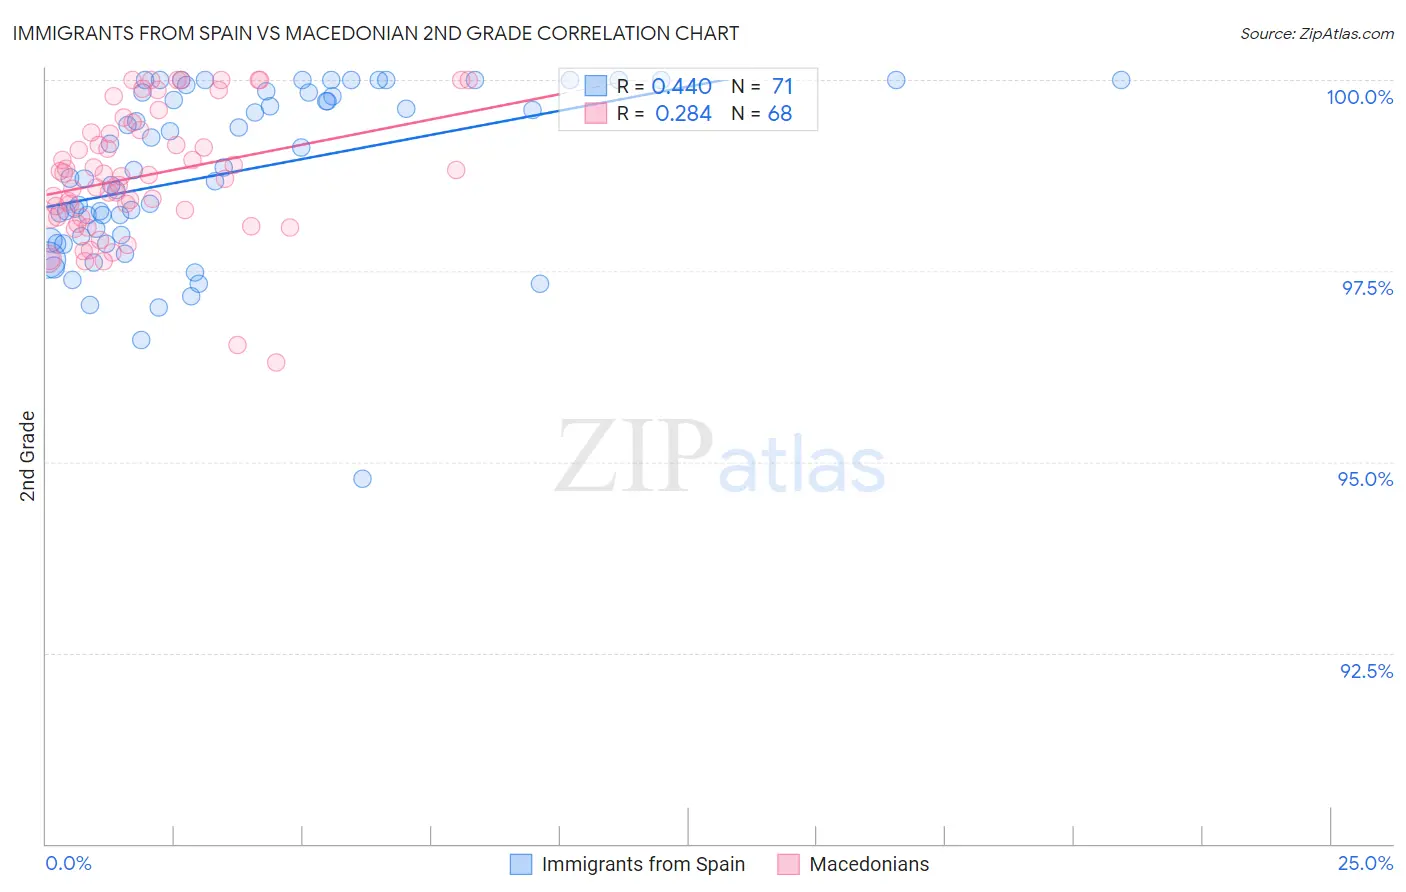
Immigrants from Spain vs Macedonian 2nd Grade Correlation Chart
The statistical analysis conducted on geographies consisting of 239,682,160 people shows a moderate positive correlation between the proportion of Immigrants from Spain and percentage of population with at least 2nd grade education in the United States with a correlation coefficient (R) of 0.440 and weighted average of 97.9%. Similarly, the statistical analysis conducted on geographies consisting of 132,592,860 people shows a weak positive correlation between the proportion of Macedonians and percentage of population with at least 2nd grade education in the United States with a correlation coefficient (R) of 0.284 and weighted average of 98.2%, a difference of 0.34%.
2nd Grade Correlation Summary
| Measurement | Immigrants from Spain | Macedonian |
| Minimum | 94.8% | 96.3% |
| Maximum | 100.0% | 100.0% |
| Range | 5.2% | 3.7% |
| Mean | 98.8% | 98.7% |
| Median | 98.8% | 98.8% |
| Interquartile 25% (IQ1) | 98.0% | 98.2% |
| Interquartile 75% (IQ3) | 99.8% | 99.3% |
| Interquartile Range (IQR) | 1.9% | 1.1% |
| Standard Deviation (Sample) | 1.1% | 0.84% |
| Standard Deviation (Population) | 1.1% | 0.83% |
Similar Demographics by 2nd Grade
Demographics Similar to Immigrants from Spain by 2nd Grade
In terms of 2nd grade, the demographic groups most similar to Immigrants from Spain are Ugandan (97.9%, a difference of 0.0%), Spanish American (97.9%, a difference of 0.0%), Immigrants from Jordan (97.9%, a difference of 0.0%), Chilean (97.9%, a difference of 0.0%), and Brazilian (97.9%, a difference of 0.0%).
| Demographics | Rating | Rank | 2nd Grade |
| Immigrants | Italy | 60.2 /100 | #162 | Good 97.9% |
| Bermudans | 59.4 /100 | #163 | Average 97.9% |
| Ugandans | 56.6 /100 | #164 | Average 97.9% |
| Spanish Americans | 56.4 /100 | #165 | Average 97.9% |
| Immigrants | Jordan | 56.3 /100 | #166 | Average 97.9% |
| Chileans | 56.1 /100 | #167 | Average 97.9% |
| Brazilians | 55.8 /100 | #168 | Average 97.9% |
| Immigrants | Spain | 55.4 /100 | #169 | Average 97.9% |
| Navajo | 54.3 /100 | #170 | Average 97.9% |
| Albanians | 52.8 /100 | #171 | Average 97.9% |
| Immigrants | Korea | 52.7 /100 | #172 | Average 97.9% |
| Kenyans | 52.7 /100 | #173 | Average 97.9% |
| Immigrants | Micronesia | 50.0 /100 | #174 | Average 97.9% |
| Immigrants | Bosnia and Herzegovina | 49.8 /100 | #175 | Average 97.9% |
| Immigrants | Sri Lanka | 48.7 /100 | #176 | Average 97.9% |
Demographics Similar to Macedonians by 2nd Grade
In terms of 2nd grade, the demographic groups most similar to Macedonians are Immigrants from Australia (98.2%, a difference of 0.0%), Immigrants from Denmark (98.2%, a difference of 0.0%), Ukrainian (98.2%, a difference of 0.0%), Delaware (98.2%, a difference of 0.010%), and Immigrants from Sweden (98.2%, a difference of 0.010%).
| Demographics | Rating | Rank | 2nd Grade |
| Icelanders | 99.2 /100 | #81 | Exceptional 98.2% |
| Delaware | 99.1 /100 | #82 | Exceptional 98.2% |
| Immigrants | Sweden | 99.1 /100 | #83 | Exceptional 98.2% |
| Hopi | 99.1 /100 | #84 | Exceptional 98.2% |
| Potawatomi | 99.1 /100 | #85 | Exceptional 98.2% |
| Immigrants | Australia | 99.0 /100 | #86 | Exceptional 98.2% |
| Immigrants | Denmark | 99.0 /100 | #87 | Exceptional 98.2% |
| Macedonians | 99.0 /100 | #88 | Exceptional 98.2% |
| Ukrainians | 98.9 /100 | #89 | Exceptional 98.2% |
| Zimbabweans | 98.8 /100 | #90 | Exceptional 98.2% |
| Immigrants | Western Europe | 98.8 /100 | #91 | Exceptional 98.2% |
| Immigrants | South Africa | 98.8 /100 | #92 | Exceptional 98.2% |
| Immigrants | India | 98.8 /100 | #93 | Exceptional 98.2% |
| Immigrants | Germany | 98.6 /100 | #94 | Exceptional 98.2% |
| South Africans | 98.6 /100 | #95 | Exceptional 98.2% |