Finnish vs Immigrants from South Eastern Asia 2nd Grade
COMPARE
Finnish
Immigrants from South Eastern Asia
2nd Grade
2nd Grade Comparison
Finns
Immigrants from South Eastern Asia
98.5%
2ND GRADE
100.0/ 100
METRIC RATING
19th/ 347
METRIC RANK
97.0%
2ND GRADE
0.0/ 100
METRIC RATING
300th/ 347
METRIC RANK
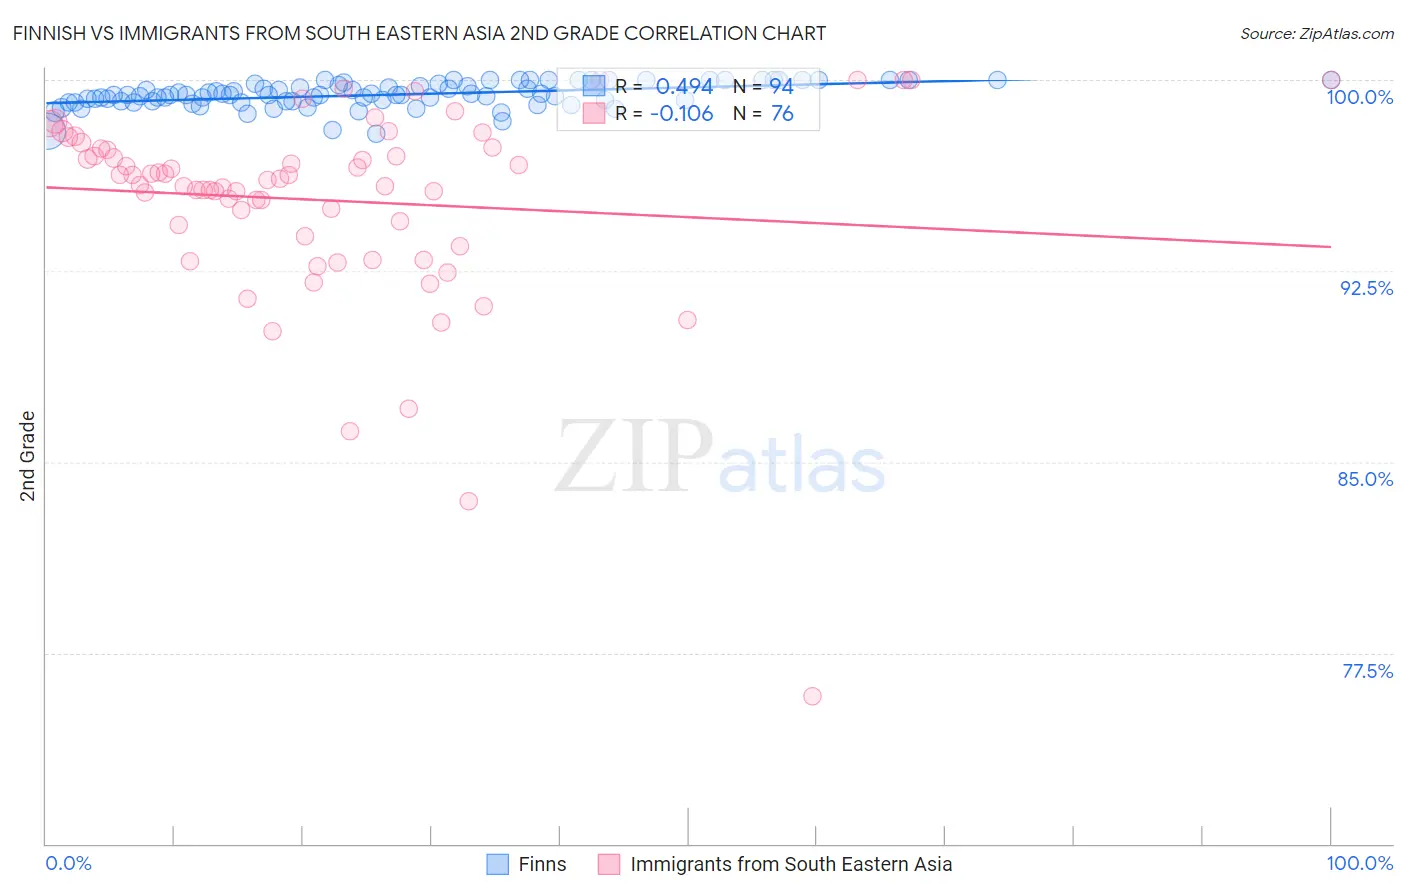
Finnish vs Immigrants from South Eastern Asia 2nd Grade Correlation Chart
The statistical analysis conducted on geographies consisting of 404,675,516 people shows a moderate positive correlation between the proportion of Finns and percentage of population with at least 2nd grade education in the United States with a correlation coefficient (R) of 0.494 and weighted average of 98.5%. Similarly, the statistical analysis conducted on geographies consisting of 512,710,277 people shows a poor negative correlation between the proportion of Immigrants from South Eastern Asia and percentage of population with at least 2nd grade education in the United States with a correlation coefficient (R) of -0.106 and weighted average of 97.0%, a difference of 1.6%.
2nd Grade Correlation Summary
| Measurement | Finnish | Immigrants from South Eastern Asia |
| Minimum | 97.9% | 75.8% |
| Maximum | 100.0% | 100.0% |
| Range | 2.1% | 24.2% |
| Mean | 99.4% | 95.3% |
| Median | 99.4% | 96.1% |
| Interquartile 25% (IQ1) | 99.2% | 94.1% |
| Interquartile 75% (IQ3) | 99.9% | 97.3% |
| Interquartile Range (IQR) | 0.70% | 3.2% |
| Standard Deviation (Sample) | 0.48% | 3.9% |
| Standard Deviation (Population) | 0.47% | 3.9% |
Similar Demographics by 2nd Grade
Demographics Similar to Finns by 2nd Grade
In terms of 2nd grade, the demographic groups most similar to Finns are Sioux (98.5%, a difference of 0.0%), Lithuanian (98.5%, a difference of 0.0%), Polish (98.5%, a difference of 0.0%), Danish (98.5%, a difference of 0.0%), and Pennsylvania German (98.5%, a difference of 0.0%).
| Demographics | Rating | Rank | 2nd Grade |
| Carpatho Rusyns | 100.0 /100 | #12 | Exceptional 98.6% |
| English | 100.0 /100 | #13 | Exceptional 98.6% |
| Swedes | 100.0 /100 | #14 | Exceptional 98.6% |
| Scottish | 100.0 /100 | #15 | Exceptional 98.6% |
| Dutch | 100.0 /100 | #16 | Exceptional 98.6% |
| Aleuts | 100.0 /100 | #17 | Exceptional 98.6% |
| Irish | 100.0 /100 | #18 | Exceptional 98.6% |
| Finns | 100.0 /100 | #19 | Exceptional 98.5% |
| Sioux | 100.0 /100 | #20 | Exceptional 98.5% |
| Lithuanians | 100.0 /100 | #21 | Exceptional 98.5% |
| Poles | 100.0 /100 | #22 | Exceptional 98.5% |
| Danes | 100.0 /100 | #23 | Exceptional 98.5% |
| Pennsylvania Germans | 100.0 /100 | #24 | Exceptional 98.5% |
| Scotch-Irish | 100.0 /100 | #25 | Exceptional 98.5% |
| Welsh | 100.0 /100 | #26 | Exceptional 98.5% |
Demographics Similar to Immigrants from South Eastern Asia by 2nd Grade
In terms of 2nd grade, the demographic groups most similar to Immigrants from South Eastern Asia are Immigrants from Cuba (97.0%, a difference of 0.020%), Immigrants from Dominica (97.0%, a difference of 0.020%), Haitian (97.0%, a difference of 0.020%), Central American Indian (97.0%, a difference of 0.020%), and Somali (97.0%, a difference of 0.040%).
| Demographics | Rating | Rank | 2nd Grade |
| British West Indians | 0.0 /100 | #293 | Tragic 97.2% |
| Malaysians | 0.0 /100 | #294 | Tragic 97.1% |
| Immigrants | Grenada | 0.0 /100 | #295 | Tragic 97.1% |
| Immigrants | Immigrants | 0.0 /100 | #296 | Tragic 97.1% |
| Immigrants | Cuba | 0.0 /100 | #297 | Tragic 97.0% |
| Immigrants | Dominica | 0.0 /100 | #298 | Tragic 97.0% |
| Haitians | 0.0 /100 | #299 | Tragic 97.0% |
| Immigrants | South Eastern Asia | 0.0 /100 | #300 | Tragic 97.0% |
| Central American Indians | 0.0 /100 | #301 | Tragic 97.0% |
| Somalis | 0.0 /100 | #302 | Tragic 97.0% |
| Ecuadorians | 0.0 /100 | #303 | Tragic 96.9% |
| Immigrants | Caribbean | 0.0 /100 | #304 | Tragic 96.9% |
| Nicaraguans | 0.0 /100 | #305 | Tragic 96.9% |
| Immigrants | Somalia | 0.0 /100 | #306 | Tragic 96.9% |
| Immigrants | Azores | 0.0 /100 | #307 | Tragic 96.8% |