Immigrants from Southern Europe vs Sudanese Kindergarten
COMPARE
Immigrants from Southern Europe
Sudanese
Kindergarten
Kindergarten Comparison
Immigrants from Southern Europe
Sudanese
97.8%
KINDERGARTEN
18.0/ 100
METRIC RATING
205th/ 347
METRIC RANK
97.7%
KINDERGARTEN
3.7/ 100
METRIC RATING
226th/ 347
METRIC RANK
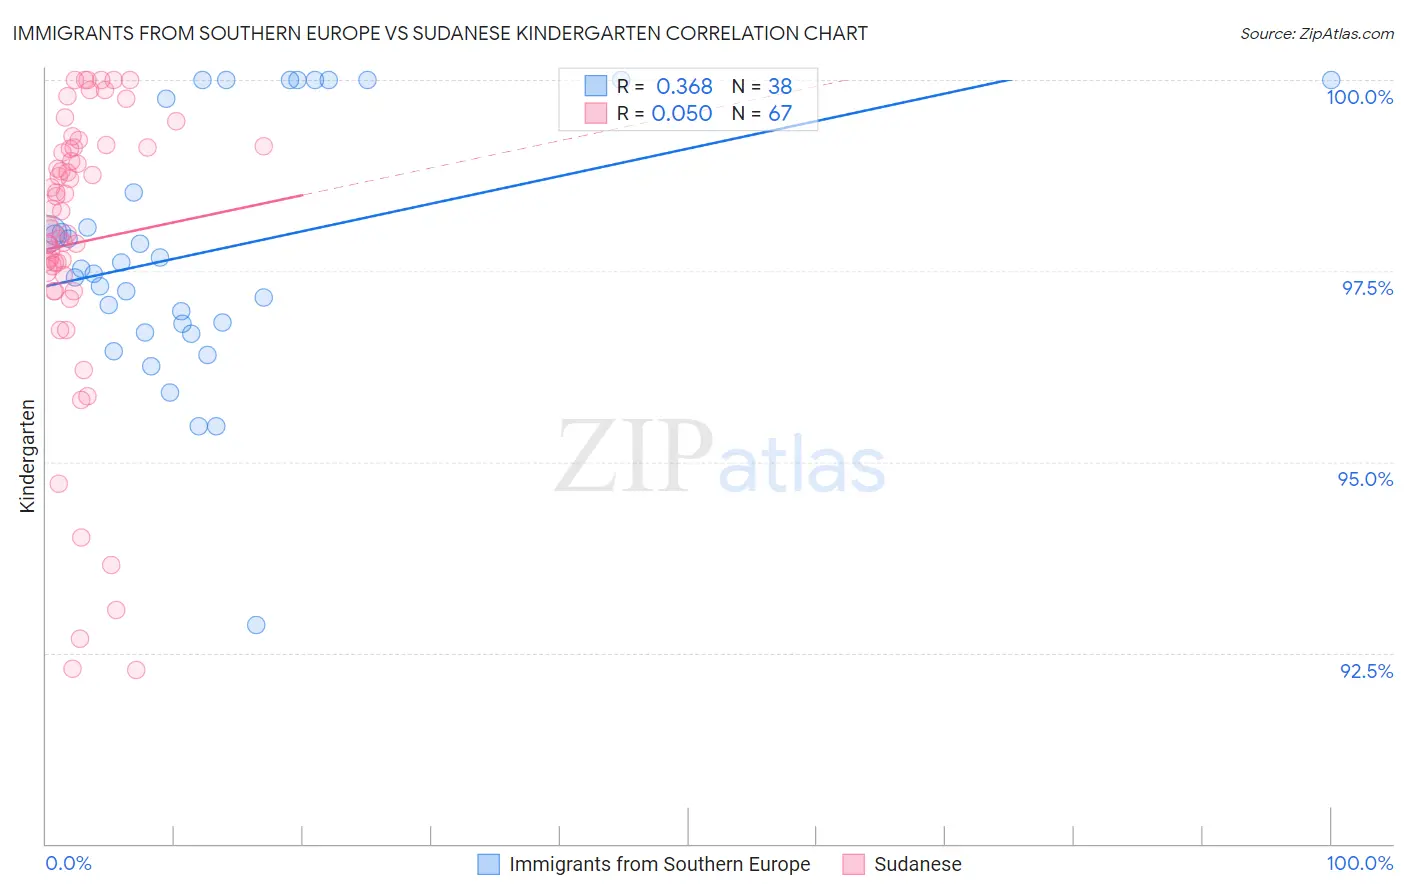
Immigrants from Southern Europe vs Sudanese Kindergarten Correlation Chart
The statistical analysis conducted on geographies consisting of 402,804,595 people shows a mild positive correlation between the proportion of Immigrants from Southern Europe and percentage of population with at least kindergarten education in the United States with a correlation coefficient (R) of 0.368 and weighted average of 97.8%. Similarly, the statistical analysis conducted on geographies consisting of 110,145,984 people shows a slight positive correlation between the proportion of Sudanese and percentage of population with at least kindergarten education in the United States with a correlation coefficient (R) of 0.050 and weighted average of 97.7%, a difference of 0.13%.
Kindergarten Correlation Summary
| Measurement | Immigrants from Southern Europe | Sudanese |
| Minimum | 92.9% | 92.3% |
| Maximum | 100.0% | 100.0% |
| Range | 7.1% | 7.7% |
| Mean | 97.8% | 97.9% |
| Median | 97.6% | 98.3% |
| Interquartile 25% (IQ1) | 96.8% | 97.5% |
| Interquartile 75% (IQ3) | 99.8% | 99.1% |
| Interquartile Range (IQR) | 2.9% | 1.7% |
| Standard Deviation (Sample) | 1.6% | 1.9% |
| Standard Deviation (Population) | 1.6% | 1.9% |
Similar Demographics by Kindergarten
Demographics Similar to Immigrants from Southern Europe by Kindergarten
In terms of kindergarten, the demographic groups most similar to Immigrants from Southern Europe are Immigrants from Uganda (97.8%, a difference of 0.0%), Immigrants from Chile (97.8%, a difference of 0.0%), Immigrants from Lebanon (97.9%, a difference of 0.010%), Immigrants from Ukraine (97.8%, a difference of 0.010%), and Immigrants from Albania (97.8%, a difference of 0.010%).
| Demographics | Rating | Rank | Kindergarten |
| Tohono O'odham | 24.6 /100 | #198 | Fair 97.9% |
| Immigrants | Egypt | 22.3 /100 | #199 | Fair 97.9% |
| Yuman | 21.6 /100 | #200 | Fair 97.9% |
| Immigrants | Lebanon | 20.9 /100 | #201 | Fair 97.9% |
| Immigrants | Ukraine | 19.1 /100 | #202 | Poor 97.8% |
| Immigrants | Uganda | 18.8 /100 | #203 | Poor 97.8% |
| Immigrants | Chile | 18.1 /100 | #204 | Poor 97.8% |
| Immigrants | Southern Europe | 18.0 /100 | #205 | Poor 97.8% |
| Immigrants | Albania | 16.4 /100 | #206 | Poor 97.8% |
| Africans | 16.1 /100 | #207 | Poor 97.8% |
| Immigrants | Northern Africa | 12.0 /100 | #208 | Poor 97.8% |
| Costa Ricans | 11.6 /100 | #209 | Poor 97.8% |
| Immigrants | Oceania | 11.1 /100 | #210 | Poor 97.8% |
| Laotians | 10.5 /100 | #211 | Poor 97.8% |
| Moroccans | 8.9 /100 | #212 | Tragic 97.8% |
Demographics Similar to Sudanese by Kindergarten
In terms of kindergarten, the demographic groups most similar to Sudanese are Iraqi (97.7%, a difference of 0.0%), Immigrants from Nepal (97.7%, a difference of 0.0%), Immigrants from Costa Rica (97.7%, a difference of 0.0%), Subsaharan African (97.7%, a difference of 0.0%), and Immigrants from Syria (97.7%, a difference of 0.010%).
| Demographics | Rating | Rank | Kindergarten |
| Immigrants | Panama | 5.0 /100 | #219 | Tragic 97.7% |
| Tongans | 4.8 /100 | #220 | Tragic 97.7% |
| Immigrants | Zaire | 4.5 /100 | #221 | Tragic 97.7% |
| Immigrants | Sudan | 4.5 /100 | #222 | Tragic 97.7% |
| Immigrants | Syria | 4.3 /100 | #223 | Tragic 97.7% |
| Iraqis | 3.9 /100 | #224 | Tragic 97.7% |
| Immigrants | Nepal | 3.8 /100 | #225 | Tragic 97.7% |
| Sudanese | 3.7 /100 | #226 | Tragic 97.7% |
| Immigrants | Costa Rica | 3.6 /100 | #227 | Tragic 97.7% |
| Sub-Saharan Africans | 3.5 /100 | #228 | Tragic 97.7% |
| Sierra Leoneans | 3.4 /100 | #229 | Tragic 97.7% |
| Senegalese | 3.3 /100 | #230 | Tragic 97.7% |
| Puerto Ricans | 2.7 /100 | #231 | Tragic 97.7% |
| Immigrants | Uruguay | 2.6 /100 | #232 | Tragic 97.7% |
| Immigrants | Pakistan | 2.2 /100 | #233 | Tragic 97.7% |