Immigrants from Southern Europe vs Austrian Kindergarten
COMPARE
Immigrants from Southern Europe
Austrian
Kindergarten
Kindergarten Comparison
Immigrants from Southern Europe
Austrians
97.8%
KINDERGARTEN
18.0/ 100
METRIC RATING
205th/ 347
METRIC RANK
98.4%
KINDERGARTEN
99.8/ 100
METRIC RATING
57th/ 347
METRIC RANK
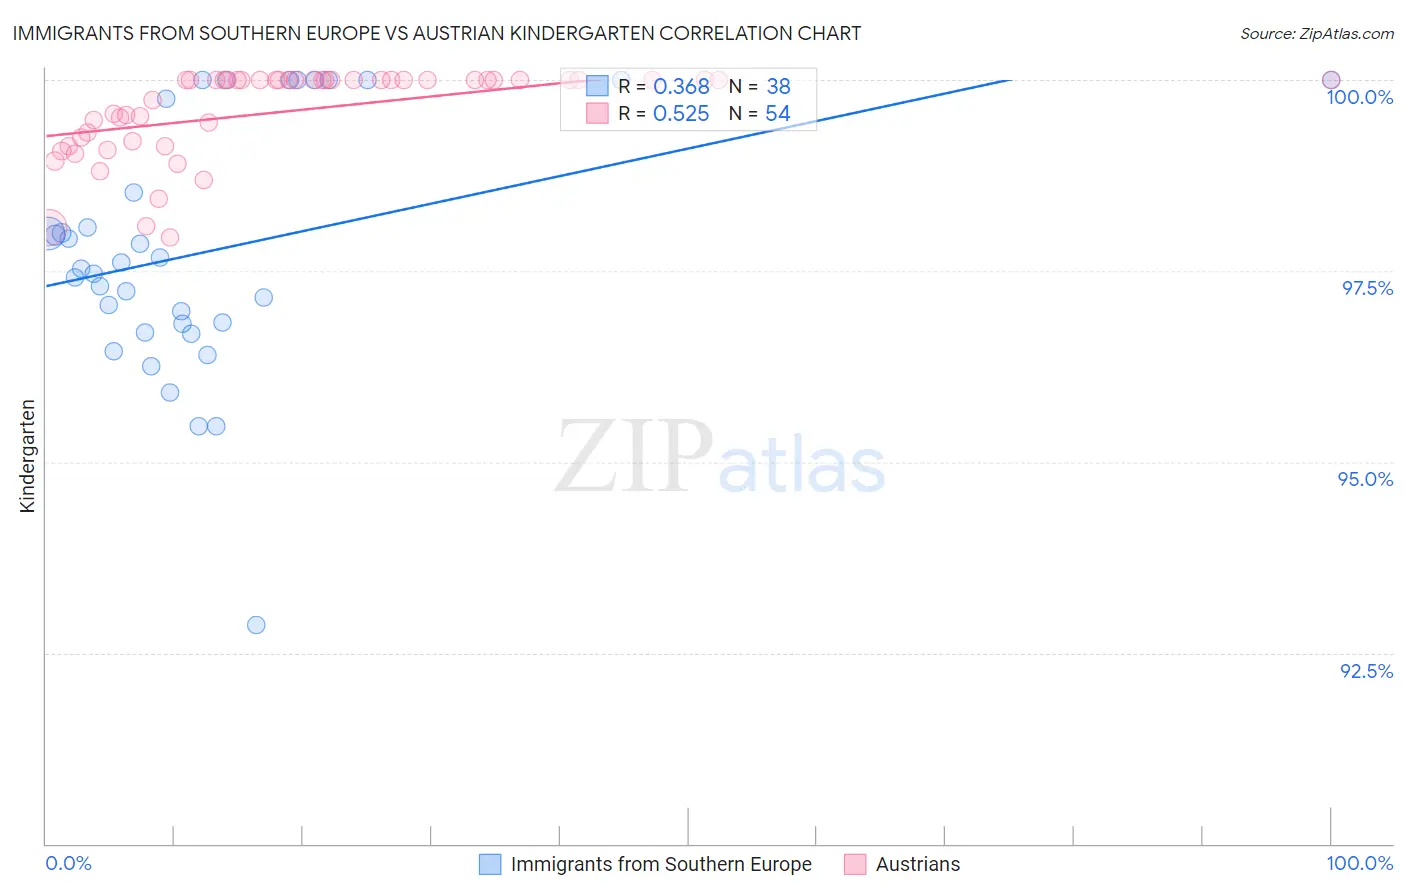
Immigrants from Southern Europe vs Austrian Kindergarten Correlation Chart
The statistical analysis conducted on geographies consisting of 402,804,595 people shows a mild positive correlation between the proportion of Immigrants from Southern Europe and percentage of population with at least kindergarten education in the United States with a correlation coefficient (R) of 0.368 and weighted average of 97.8%. Similarly, the statistical analysis conducted on geographies consisting of 452,080,536 people shows a substantial positive correlation between the proportion of Austrians and percentage of population with at least kindergarten education in the United States with a correlation coefficient (R) of 0.525 and weighted average of 98.4%, a difference of 0.58%.
Kindergarten Correlation Summary
| Measurement | Immigrants from Southern Europe | Austrian |
| Minimum | 92.9% | 97.9% |
| Maximum | 100.0% | 100.0% |
| Range | 7.1% | 2.1% |
| Mean | 97.8% | 99.6% |
| Median | 97.6% | 100.0% |
| Interquartile 25% (IQ1) | 96.8% | 99.2% |
| Interquartile 75% (IQ3) | 99.8% | 100.0% |
| Interquartile Range (IQR) | 2.9% | 0.81% |
| Standard Deviation (Sample) | 1.6% | 0.58% |
| Standard Deviation (Population) | 1.6% | 0.57% |
Similar Demographics by Kindergarten
Demographics Similar to Immigrants from Southern Europe by Kindergarten
In terms of kindergarten, the demographic groups most similar to Immigrants from Southern Europe are Immigrants from Uganda (97.8%, a difference of 0.0%), Immigrants from Chile (97.8%, a difference of 0.0%), Immigrants from Lebanon (97.9%, a difference of 0.010%), Immigrants from Ukraine (97.8%, a difference of 0.010%), and Immigrants from Albania (97.8%, a difference of 0.010%).
| Demographics | Rating | Rank | Kindergarten |
| Tohono O'odham | 24.6 /100 | #198 | Fair 97.9% |
| Immigrants | Egypt | 22.3 /100 | #199 | Fair 97.9% |
| Yuman | 21.6 /100 | #200 | Fair 97.9% |
| Immigrants | Lebanon | 20.9 /100 | #201 | Fair 97.9% |
| Immigrants | Ukraine | 19.1 /100 | #202 | Poor 97.8% |
| Immigrants | Uganda | 18.8 /100 | #203 | Poor 97.8% |
| Immigrants | Chile | 18.1 /100 | #204 | Poor 97.8% |
| Immigrants | Southern Europe | 18.0 /100 | #205 | Poor 97.8% |
| Immigrants | Albania | 16.4 /100 | #206 | Poor 97.8% |
| Africans | 16.1 /100 | #207 | Poor 97.8% |
| Immigrants | Northern Africa | 12.0 /100 | #208 | Poor 97.8% |
| Costa Ricans | 11.6 /100 | #209 | Poor 97.8% |
| Immigrants | Oceania | 11.1 /100 | #210 | Poor 97.8% |
| Laotians | 10.5 /100 | #211 | Poor 97.8% |
| Moroccans | 8.9 /100 | #212 | Tragic 97.8% |
Demographics Similar to Austrians by Kindergarten
In terms of kindergarten, the demographic groups most similar to Austrians are American (98.4%, a difference of 0.0%), Bulgarian (98.4%, a difference of 0.0%), Immigrants from Scotland (98.4%, a difference of 0.010%), Immigrants from Canada (98.4%, a difference of 0.010%), and Creek (98.4%, a difference of 0.010%).
| Demographics | Rating | Rank | Kindergarten |
| Whites/Caucasians | 99.8 /100 | #50 | Exceptional 98.4% |
| Estonians | 99.8 /100 | #51 | Exceptional 98.4% |
| Australians | 99.8 /100 | #52 | Exceptional 98.4% |
| Celtics | 99.8 /100 | #53 | Exceptional 98.4% |
| Pueblo | 99.8 /100 | #54 | Exceptional 98.4% |
| Immigrants | Scotland | 99.8 /100 | #55 | Exceptional 98.4% |
| Americans | 99.8 /100 | #56 | Exceptional 98.4% |
| Austrians | 99.8 /100 | #57 | Exceptional 98.4% |
| Bulgarians | 99.7 /100 | #58 | Exceptional 98.4% |
| Immigrants | Canada | 99.7 /100 | #59 | Exceptional 98.4% |
| Creek | 99.7 /100 | #60 | Exceptional 98.4% |
| Slavs | 99.7 /100 | #61 | Exceptional 98.4% |
| New Zealanders | 99.7 /100 | #62 | Exceptional 98.4% |
| Immigrants | North America | 99.7 /100 | #63 | Exceptional 98.4% |
| Greeks | 99.7 /100 | #64 | Exceptional 98.4% |