Immigrants from South Eastern Asia vs Immigrants from Barbados GED/Equivalency
COMPARE
Immigrants from South Eastern Asia
Immigrants from Barbados
GED/Equivalency
GED/Equivalency Comparison
Immigrants from South Eastern Asia
Immigrants from Barbados
84.1%
GED/EQUIVALENCY
2.5/ 100
METRIC RATING
240th/ 347
METRIC RANK
82.4%
GED/EQUIVALENCY
0.1/ 100
METRIC RATING
284th/ 347
METRIC RANK
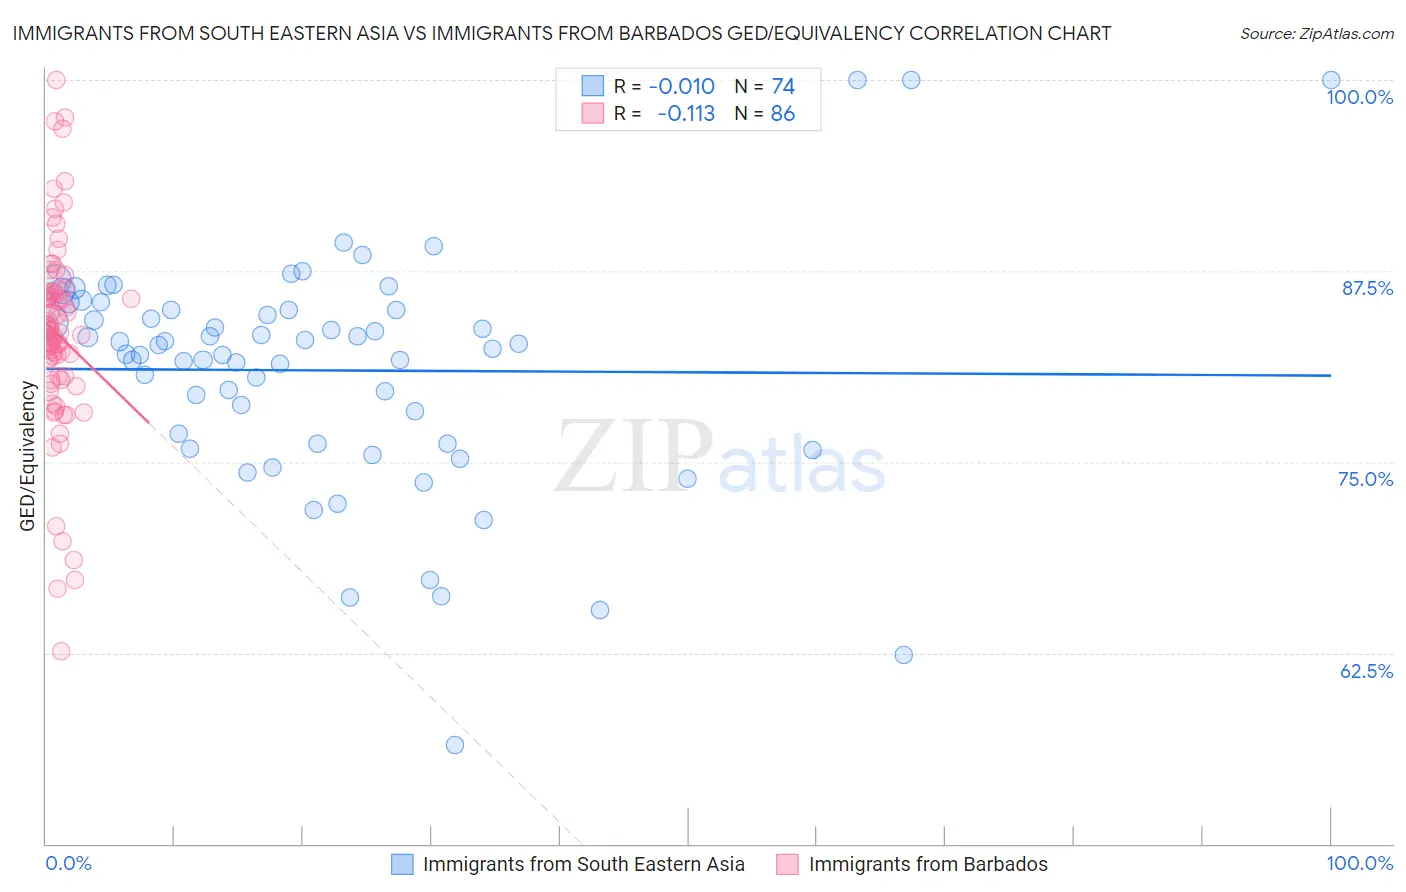
Immigrants from South Eastern Asia vs Immigrants from Barbados GED/Equivalency Correlation Chart
The statistical analysis conducted on geographies consisting of 512,708,901 people shows no correlation between the proportion of Immigrants from South Eastern Asia and percentage of population with at least ged/equivalency education in the United States with a correlation coefficient (R) of -0.010 and weighted average of 84.1%. Similarly, the statistical analysis conducted on geographies consisting of 112,783,324 people shows a poor negative correlation between the proportion of Immigrants from Barbados and percentage of population with at least ged/equivalency education in the United States with a correlation coefficient (R) of -0.113 and weighted average of 82.4%, a difference of 2.1%.
GED/Equivalency Correlation Summary
| Measurement | Immigrants from South Eastern Asia | Immigrants from Barbados |
| Minimum | 56.5% | 62.6% |
| Maximum | 100.0% | 100.0% |
| Range | 43.5% | 37.4% |
| Mean | 81.0% | 83.4% |
| Median | 82.5% | 83.5% |
| Interquartile 25% (IQ1) | 76.2% | 80.6% |
| Interquartile 75% (IQ3) | 84.9% | 86.1% |
| Interquartile Range (IQR) | 8.8% | 5.5% |
| Standard Deviation (Sample) | 7.6% | 6.4% |
| Standard Deviation (Population) | 7.6% | 6.4% |
Similar Demographics by GED/Equivalency
Demographics Similar to Immigrants from South Eastern Asia by GED/Equivalency
In terms of ged/equivalency, the demographic groups most similar to Immigrants from South Eastern Asia are Immigrants from Bahamas (84.2%, a difference of 0.020%), Immigrants from Peru (84.2%, a difference of 0.040%), Subsaharan African (84.2%, a difference of 0.10%), Senegalese (84.0%, a difference of 0.14%), and Sri Lankan (84.0%, a difference of 0.16%).
| Demographics | Rating | Rank | GED/Equivalency |
| Immigrants | Panama | 4.1 /100 | #233 | Tragic 84.4% |
| Immigrants | Nigeria | 3.6 /100 | #234 | Tragic 84.3% |
| Ghanaians | 3.5 /100 | #235 | Tragic 84.3% |
| Immigrants | Eritrea | 3.5 /100 | #236 | Tragic 84.3% |
| Sub-Saharan Africans | 3.0 /100 | #237 | Tragic 84.2% |
| Immigrants | Peru | 2.7 /100 | #238 | Tragic 84.2% |
| Immigrants | Bahamas | 2.6 /100 | #239 | Tragic 84.2% |
| Immigrants | South Eastern Asia | 2.5 /100 | #240 | Tragic 84.1% |
| Senegalese | 1.9 /100 | #241 | Tragic 84.0% |
| Sri Lankans | 1.9 /100 | #242 | Tragic 84.0% |
| Cherokee | 1.3 /100 | #243 | Tragic 83.9% |
| Immigrants | Ghana | 1.3 /100 | #244 | Tragic 83.9% |
| Immigrants | Senegal | 1.2 /100 | #245 | Tragic 83.8% |
| Chickasaw | 1.2 /100 | #246 | Tragic 83.8% |
| Immigrants | Western Africa | 1.1 /100 | #247 | Tragic 83.8% |
Demographics Similar to Immigrants from Barbados by GED/Equivalency
In terms of ged/equivalency, the demographic groups most similar to Immigrants from Barbados are Cajun (82.4%, a difference of 0.030%), Immigrants from West Indies (82.4%, a difference of 0.060%), Japanese (82.4%, a difference of 0.070%), Indonesian (82.5%, a difference of 0.12%), and Immigrants (82.6%, a difference of 0.16%).
| Demographics | Rating | Rank | GED/Equivalency |
| Arapaho | 0.1 /100 | #277 | Tragic 82.8% |
| Immigrants | Laos | 0.1 /100 | #278 | Tragic 82.7% |
| Immigrants | Fiji | 0.1 /100 | #279 | Tragic 82.7% |
| Cheyenne | 0.1 /100 | #280 | Tragic 82.7% |
| Sioux | 0.1 /100 | #281 | Tragic 82.6% |
| Immigrants | Immigrants | 0.1 /100 | #282 | Tragic 82.6% |
| Indonesians | 0.1 /100 | #283 | Tragic 82.5% |
| Immigrants | Barbados | 0.1 /100 | #284 | Tragic 82.4% |
| Cajuns | 0.0 /100 | #285 | Tragic 82.4% |
| Immigrants | West Indies | 0.0 /100 | #286 | Tragic 82.4% |
| Japanese | 0.0 /100 | #287 | Tragic 82.4% |
| Pueblo | 0.0 /100 | #288 | Tragic 82.3% |
| Immigrants | Cambodia | 0.0 /100 | #289 | Tragic 82.2% |
| Haitians | 0.0 /100 | #290 | Tragic 82.1% |
| Cubans | 0.0 /100 | #291 | Tragic 82.0% |