Alaska Native vs Ecuadorian College, 1 year or more
COMPARE
Alaska Native
Ecuadorian
College, 1 year or more
College, 1 year or more Comparison
Alaska Natives
Ecuadorians
53.4%
COLLEGE, 1 YEAR OR MORE
0.0/ 100
METRIC RATING
288th/ 347
METRIC RANK
54.3%
COLLEGE, 1 YEAR OR MORE
0.2/ 100
METRIC RATING
277th/ 347
METRIC RANK
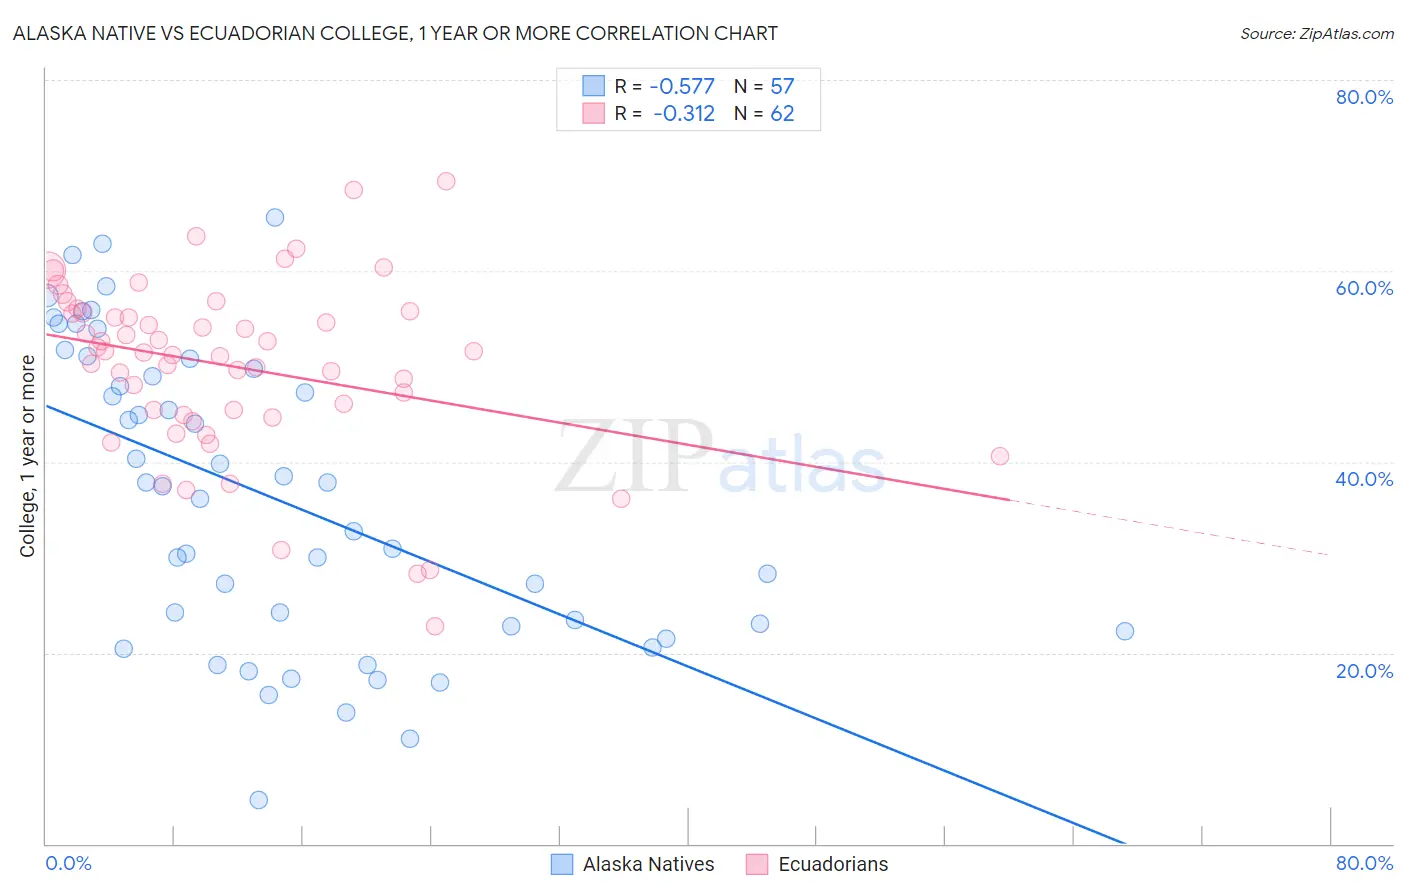
Alaska Native vs Ecuadorian College, 1 year or more Correlation Chart
The statistical analysis conducted on geographies consisting of 76,778,531 people shows a substantial negative correlation between the proportion of Alaska Natives and percentage of population with at least college, 1 year or more education in the United States with a correlation coefficient (R) of -0.577 and weighted average of 53.4%. Similarly, the statistical analysis conducted on geographies consisting of 317,865,755 people shows a mild negative correlation between the proportion of Ecuadorians and percentage of population with at least college, 1 year or more education in the United States with a correlation coefficient (R) of -0.312 and weighted average of 54.3%, a difference of 1.7%.
College, 1 year or more Correlation Summary
| Measurement | Alaska Native | Ecuadorian |
| Minimum | 4.6% | 22.7% |
| Maximum | 65.6% | 69.4% |
| Range | 61.0% | 46.6% |
| Mean | 36.3% | 50.0% |
| Median | 37.5% | 51.5% |
| Interquartile 25% (IQ1) | 22.5% | 44.9% |
| Interquartile 75% (IQ3) | 50.3% | 55.7% |
| Interquartile Range (IQR) | 27.8% | 10.7% |
| Standard Deviation (Sample) | 15.6% | 9.3% |
| Standard Deviation (Population) | 15.5% | 9.2% |
Demographics Similar to Alaska Natives and Ecuadorians by College, 1 year or more
In terms of college, 1 year or more, the demographic groups most similar to Alaska Natives are Immigrants from Ecuador (53.4%, a difference of 0.0%), Alaskan Athabascan (53.4%, a difference of 0.020%), Cuban (53.4%, a difference of 0.070%), Immigrants from Belize (53.5%, a difference of 0.17%), and Central American Indian (53.5%, a difference of 0.20%). Similarly, the demographic groups most similar to Ecuadorians are Shoshone (54.3%, a difference of 0.040%), American (54.4%, a difference of 0.12%), Belizean (54.4%, a difference of 0.15%), Immigrants from Grenada (54.4%, a difference of 0.19%), and Comanche (54.4%, a difference of 0.22%).
| Demographics | Rating | Rank | College, 1 year or more |
| Comanche | 0.2 /100 | #272 | Tragic 54.4% |
| Immigrants | Grenada | 0.2 /100 | #273 | Tragic 54.4% |
| Belizeans | 0.2 /100 | #274 | Tragic 54.4% |
| Americans | 0.2 /100 | #275 | Tragic 54.4% |
| Shoshone | 0.2 /100 | #276 | Tragic 54.3% |
| Ecuadorians | 0.2 /100 | #277 | Tragic 54.3% |
| Immigrants | Jamaica | 0.1 /100 | #278 | Tragic 54.2% |
| Arapaho | 0.1 /100 | #279 | Tragic 54.1% |
| Cheyenne | 0.1 /100 | #280 | Tragic 54.1% |
| Colville | 0.1 /100 | #281 | Tragic 54.1% |
| Guyanese | 0.1 /100 | #282 | Tragic 54.1% |
| Nicaraguans | 0.1 /100 | #283 | Tragic 53.9% |
| Ute | 0.1 /100 | #284 | Tragic 53.8% |
| Immigrants | Guyana | 0.1 /100 | #285 | Tragic 53.5% |
| Central American Indians | 0.1 /100 | #286 | Tragic 53.5% |
| Immigrants | Belize | 0.1 /100 | #287 | Tragic 53.5% |
| Alaska Natives | 0.0 /100 | #288 | Tragic 53.4% |
| Immigrants | Ecuador | 0.0 /100 | #289 | Tragic 53.4% |
| Alaskan Athabascans | 0.0 /100 | #290 | Tragic 53.4% |
| Cubans | 0.0 /100 | #291 | Tragic 53.4% |
| Chickasaw | 0.0 /100 | #292 | Tragic 53.3% |