Finnish vs Ecuadorian College, 1 year or more
COMPARE
Finnish
Ecuadorian
College, 1 year or more
College, 1 year or more Comparison
Finns
Ecuadorians
60.2%
COLLEGE, 1 YEAR OR MORE
72.9/ 100
METRIC RATING
156th/ 347
METRIC RANK
54.3%
COLLEGE, 1 YEAR OR MORE
0.2/ 100
METRIC RATING
277th/ 347
METRIC RANK
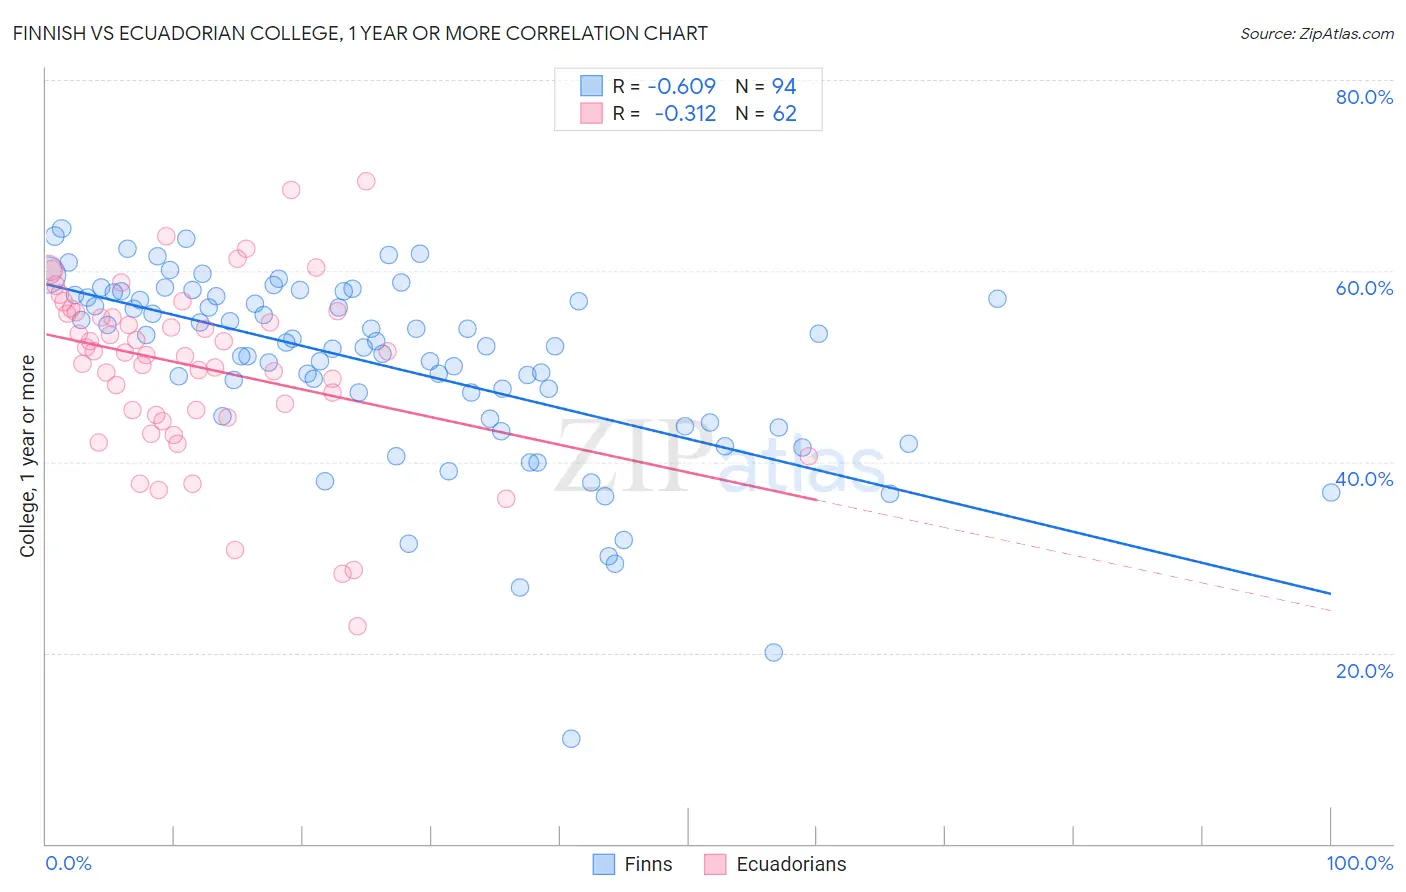
Finnish vs Ecuadorian College, 1 year or more Correlation Chart
The statistical analysis conducted on geographies consisting of 404,673,514 people shows a significant negative correlation between the proportion of Finns and percentage of population with at least college, 1 year or more education in the United States with a correlation coefficient (R) of -0.609 and weighted average of 60.2%. Similarly, the statistical analysis conducted on geographies consisting of 317,865,755 people shows a mild negative correlation between the proportion of Ecuadorians and percentage of population with at least college, 1 year or more education in the United States with a correlation coefficient (R) of -0.312 and weighted average of 54.3%, a difference of 10.8%.
College, 1 year or more Correlation Summary
| Measurement | Finnish | Ecuadorian |
| Minimum | 11.0% | 22.7% |
| Maximum | 64.4% | 69.4% |
| Range | 53.4% | 46.6% |
| Mean | 50.1% | 50.0% |
| Median | 52.3% | 51.5% |
| Interquartile 25% (IQ1) | 44.5% | 44.9% |
| Interquartile 75% (IQ3) | 57.3% | 55.7% |
| Interquartile Range (IQR) | 12.8% | 10.7% |
| Standard Deviation (Sample) | 10.0% | 9.3% |
| Standard Deviation (Population) | 9.9% | 9.2% |
Similar Demographics by College, 1 year or more
Demographics Similar to Finns by College, 1 year or more
In terms of college, 1 year or more, the demographic groups most similar to Finns are Sudanese (60.2%, a difference of 0.0%), Moroccan (60.2%, a difference of 0.0%), Sierra Leonean (60.2%, a difference of 0.080%), Immigrants from Germany (60.3%, a difference of 0.22%), and Immigrants from Armenia (60.0%, a difference of 0.26%).
| Demographics | Rating | Rank | College, 1 year or more |
| Brazilians | 79.0 /100 | #149 | Good 60.5% |
| Immigrants | Sudan | 77.8 /100 | #150 | Good 60.4% |
| Albanians | 77.8 /100 | #151 | Good 60.4% |
| Immigrants | Germany | 76.1 /100 | #152 | Good 60.3% |
| Sierra Leoneans | 74.1 /100 | #153 | Good 60.2% |
| Sudanese | 73.0 /100 | #154 | Good 60.2% |
| Moroccans | 72.9 /100 | #155 | Good 60.2% |
| Finns | 72.9 /100 | #156 | Good 60.2% |
| Immigrants | Armenia | 68.8 /100 | #157 | Good 60.0% |
| English | 67.2 /100 | #158 | Good 60.0% |
| Immigrants | Iraq | 67.0 /100 | #159 | Good 60.0% |
| South American Indians | 66.9 /100 | #160 | Good 60.0% |
| Somalis | 64.5 /100 | #161 | Good 59.9% |
| Koreans | 58.5 /100 | #162 | Average 59.7% |
| Immigrants | Somalia | 58.3 /100 | #163 | Average 59.7% |
Demographics Similar to Ecuadorians by College, 1 year or more
In terms of college, 1 year or more, the demographic groups most similar to Ecuadorians are Shoshone (54.3%, a difference of 0.040%), American (54.4%, a difference of 0.12%), Belizean (54.4%, a difference of 0.15%), Immigrants from Grenada (54.4%, a difference of 0.19%), and Comanche (54.4%, a difference of 0.22%).
| Demographics | Rating | Rank | College, 1 year or more |
| Crow | 0.2 /100 | #270 | Tragic 54.5% |
| Bahamians | 0.2 /100 | #271 | Tragic 54.5% |
| Comanche | 0.2 /100 | #272 | Tragic 54.4% |
| Immigrants | Grenada | 0.2 /100 | #273 | Tragic 54.4% |
| Belizeans | 0.2 /100 | #274 | Tragic 54.4% |
| Americans | 0.2 /100 | #275 | Tragic 54.4% |
| Shoshone | 0.2 /100 | #276 | Tragic 54.3% |
| Ecuadorians | 0.2 /100 | #277 | Tragic 54.3% |
| Immigrants | Jamaica | 0.1 /100 | #278 | Tragic 54.2% |
| Arapaho | 0.1 /100 | #279 | Tragic 54.1% |
| Cheyenne | 0.1 /100 | #280 | Tragic 54.1% |
| Colville | 0.1 /100 | #281 | Tragic 54.1% |
| Guyanese | 0.1 /100 | #282 | Tragic 54.1% |
| Nicaraguans | 0.1 /100 | #283 | Tragic 53.9% |
| Ute | 0.1 /100 | #284 | Tragic 53.8% |